Seasonal and Event Behaviour
This page focuses on behaviour: when datasets agree on events, where they miss each other (zeros vs non-zeros, timing offsets, extremes), and how datasets change over different seasons.
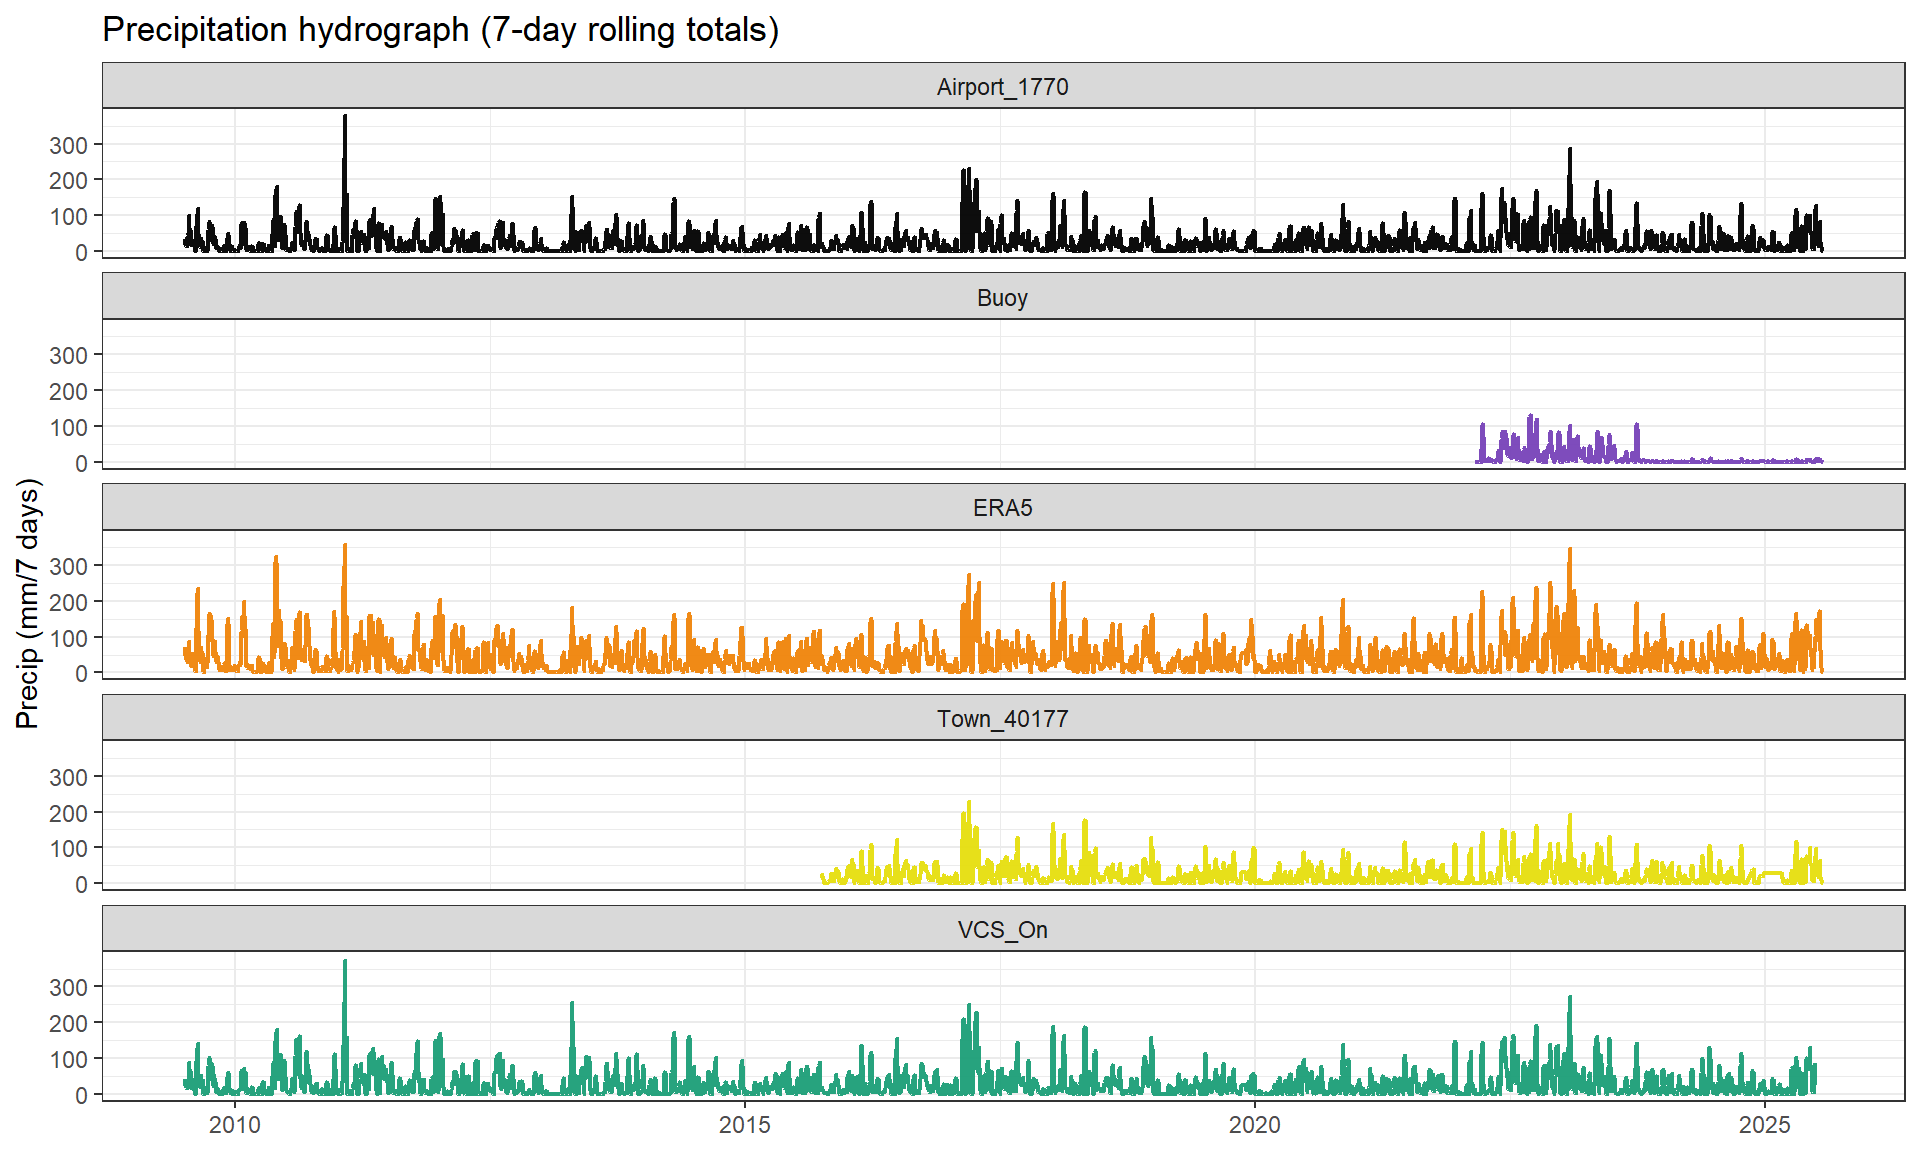
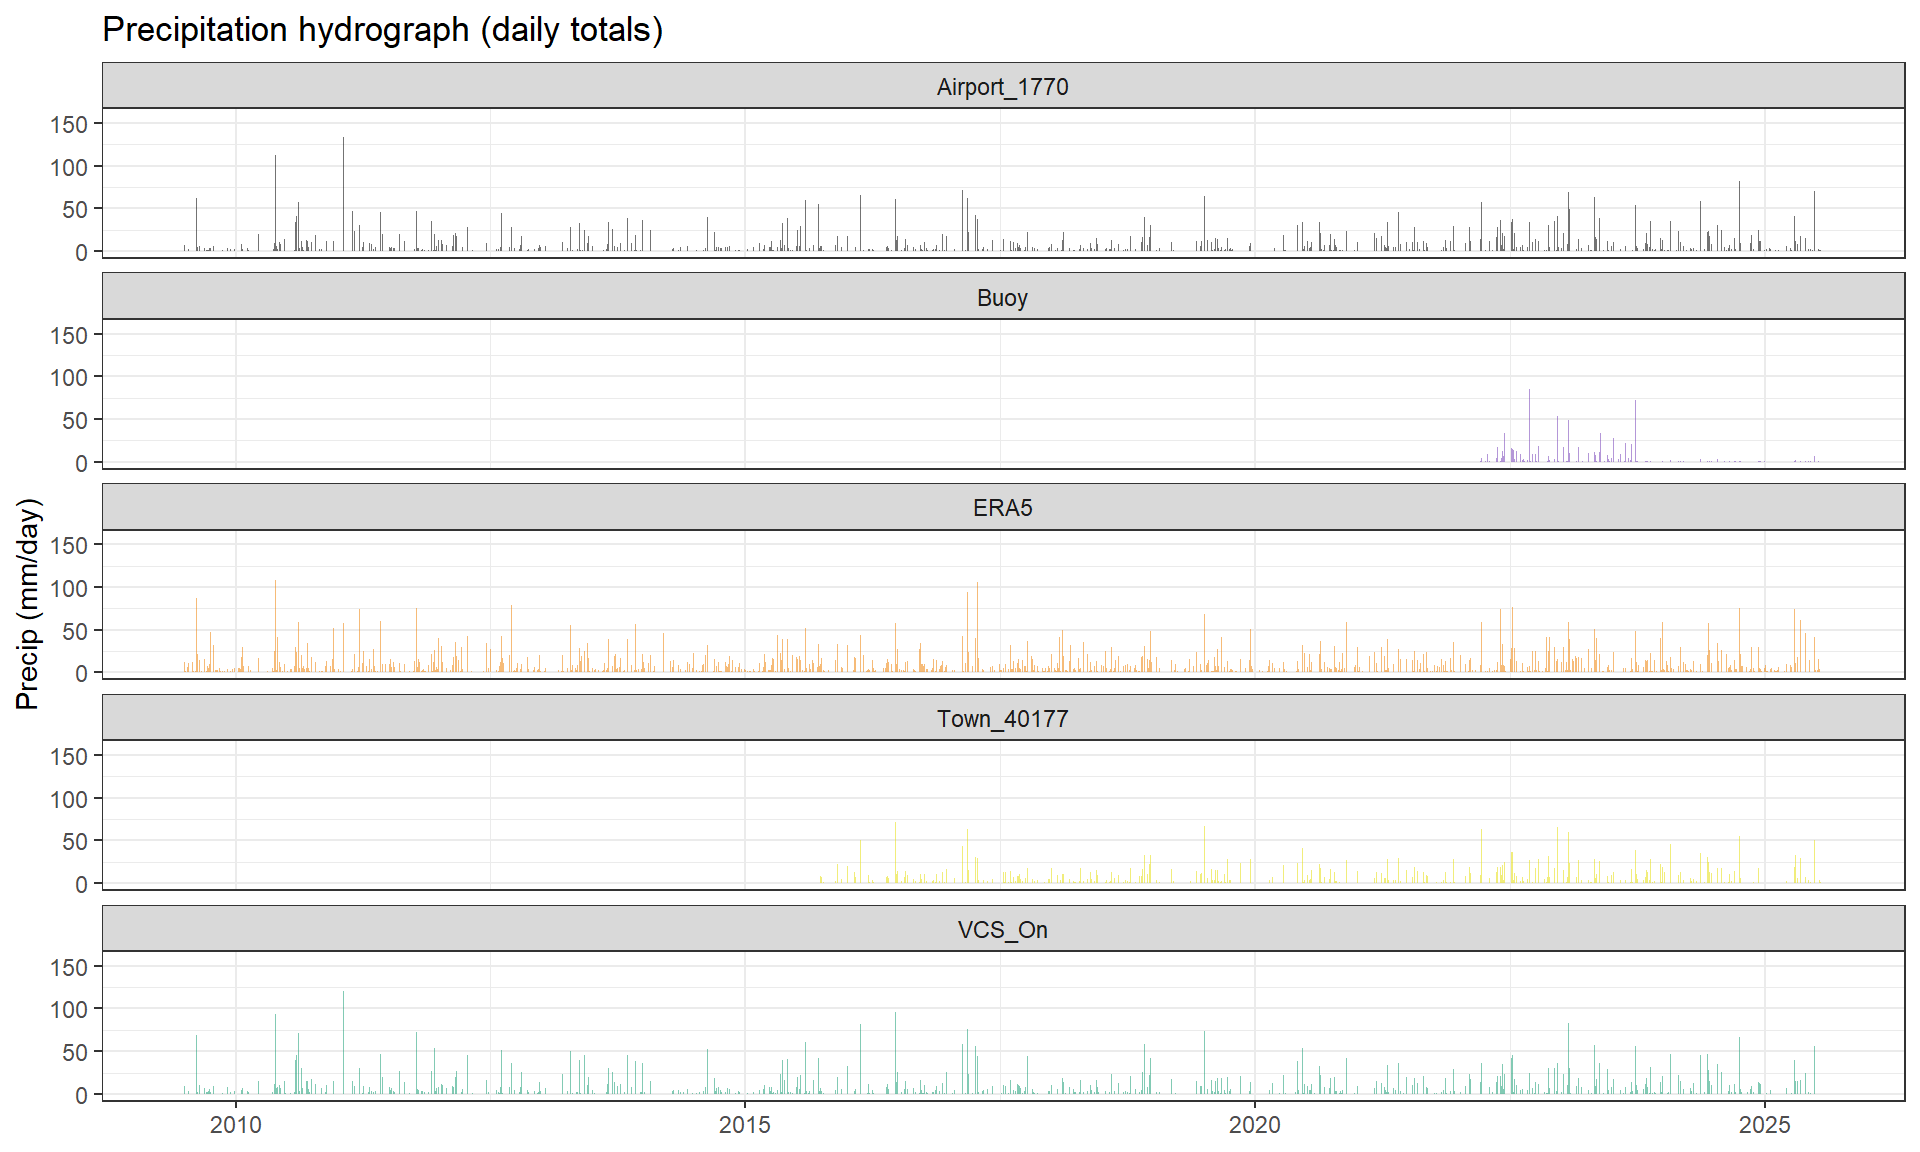
Precipitation event structure: The following plots show how precipitation volumes and timing align across datasets.
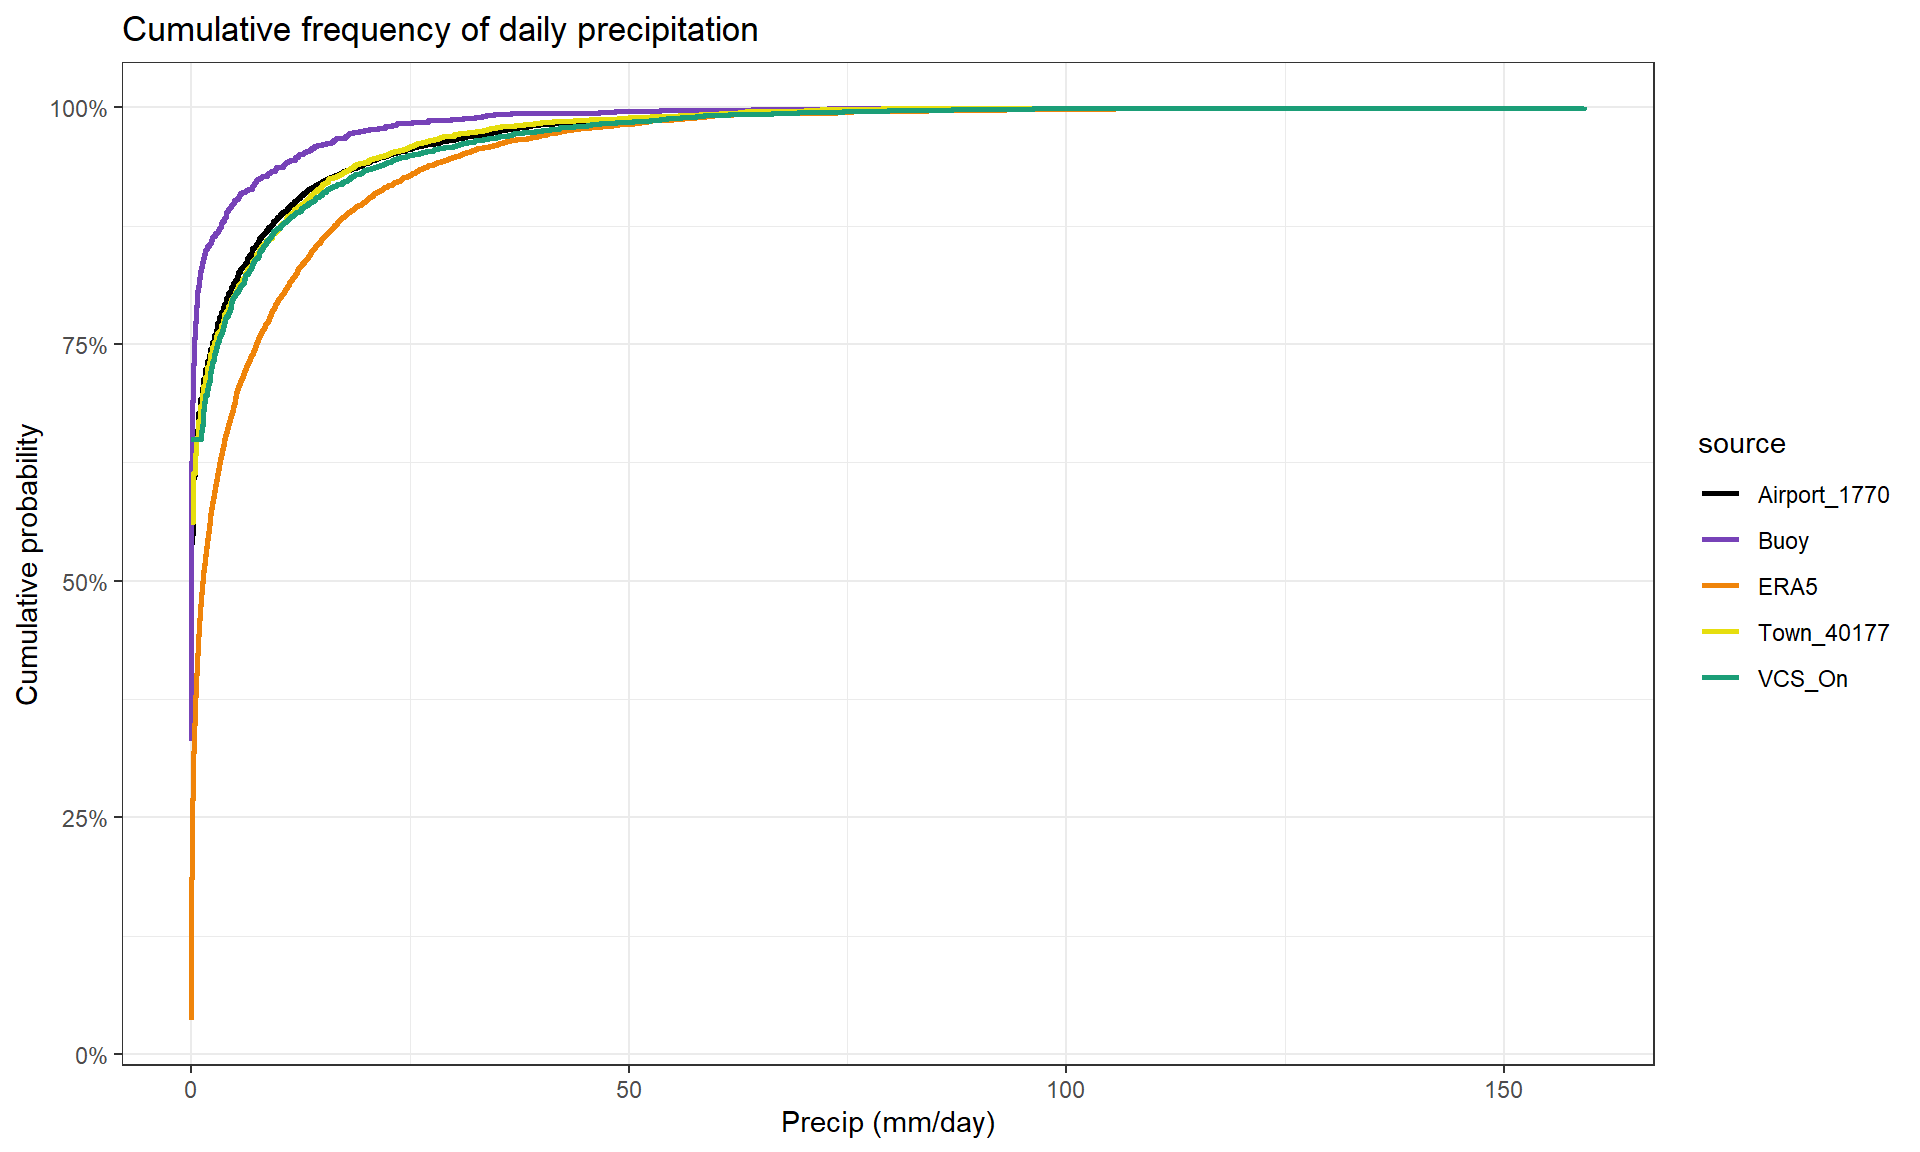
ERA5’s curve is shifted rightward, indicating more frequent moderate to high rainfall (wet bias). The buoy curve rises faster at low precipitation, indicating fewer heavy‑rain days and a tendency toward under tracking. Town_40177 and VCS_On track the reference most closely across the distribution, showing potential better fit in both light and heavy rain.
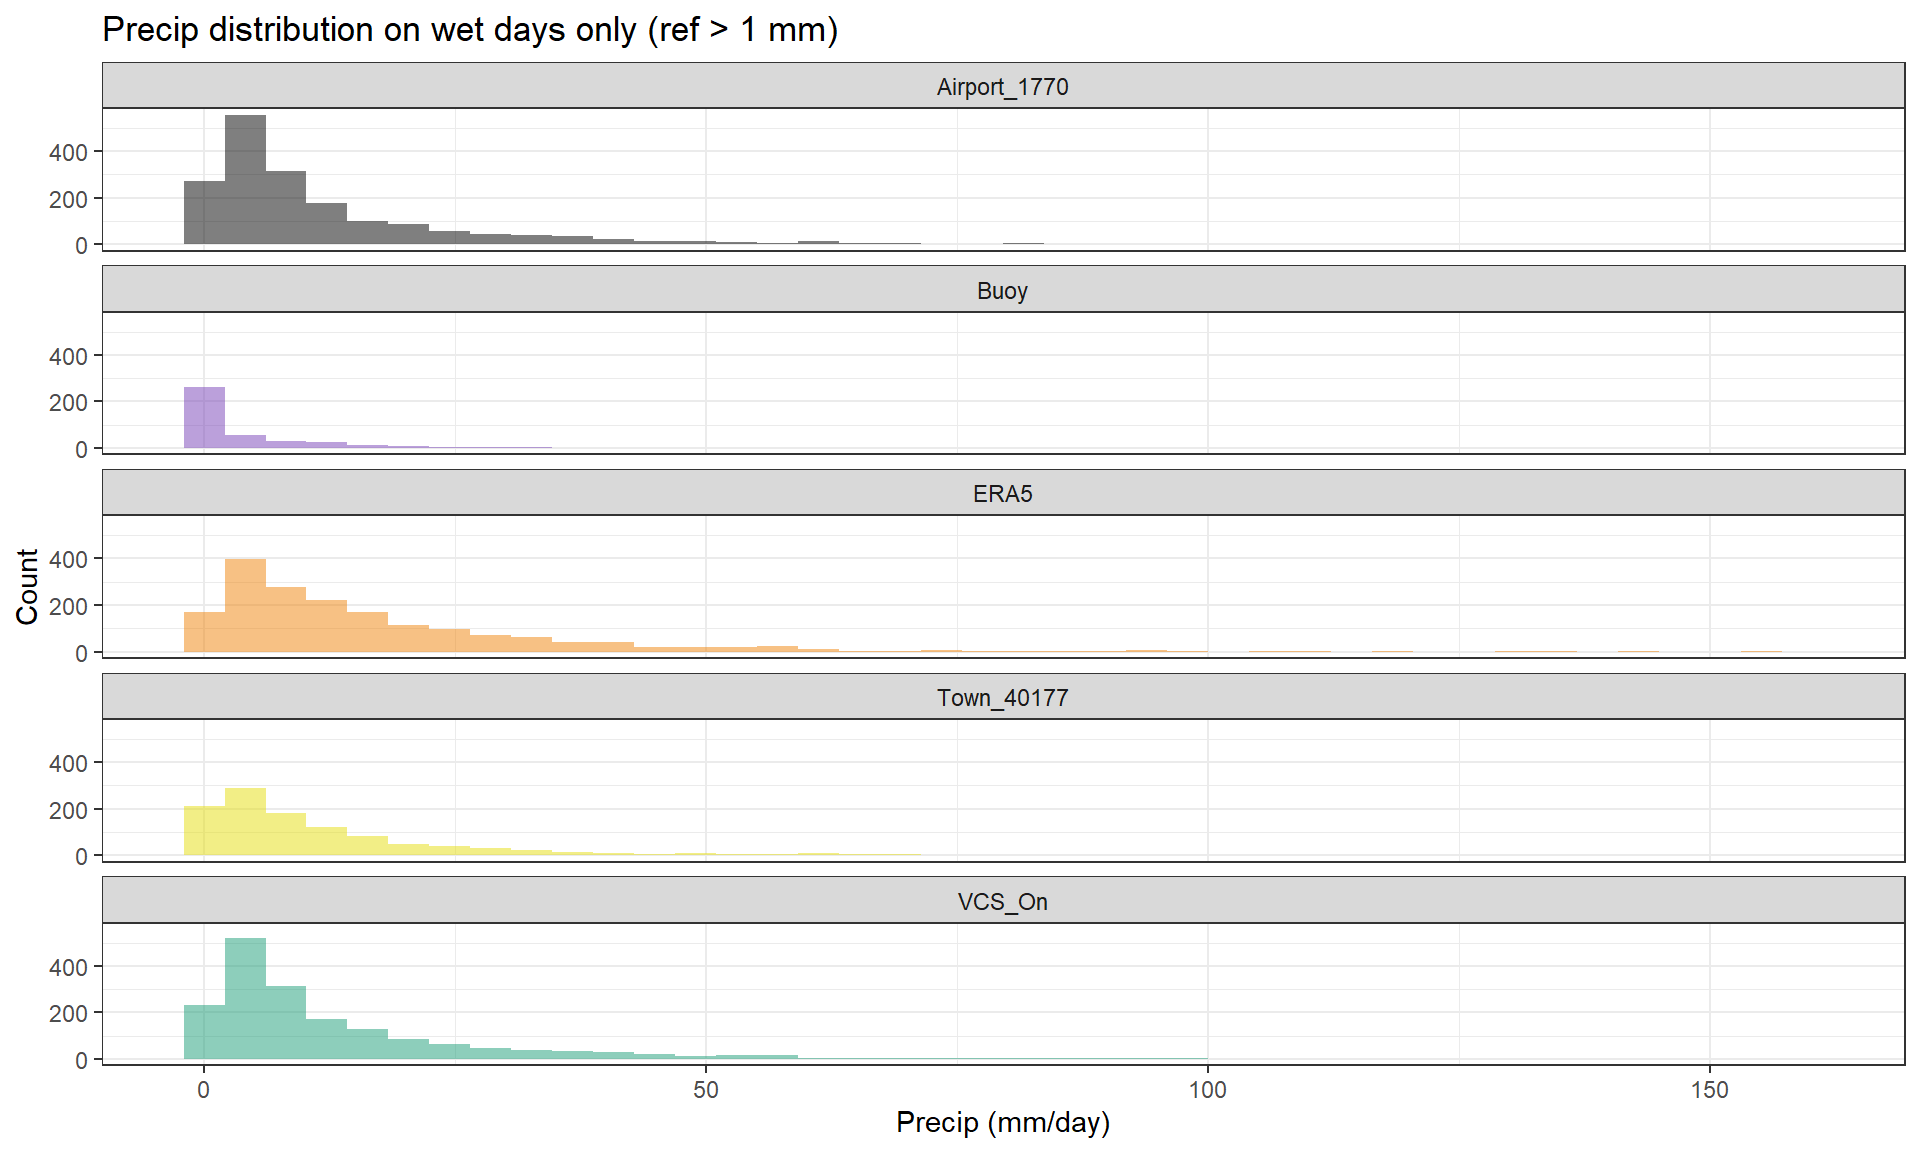
ERA5 shows the broadest distribution and the longest upper tail, which aligns with overestimation of heavier events. Town_40177 and VCS_On align more closely with the reference shape, indicating better magnitude agreement on wet days. The buoy distribution is pressed toward lower totals, indicating underestimation of event magnitudes.
Event detection and mismatches
Use these to spot zero vs non zero disagreements, misses/false alarms, and timing offsets during wet events. POD: Probability detection FAR: False alarm ratio CSI: Critical success inder Bias score:
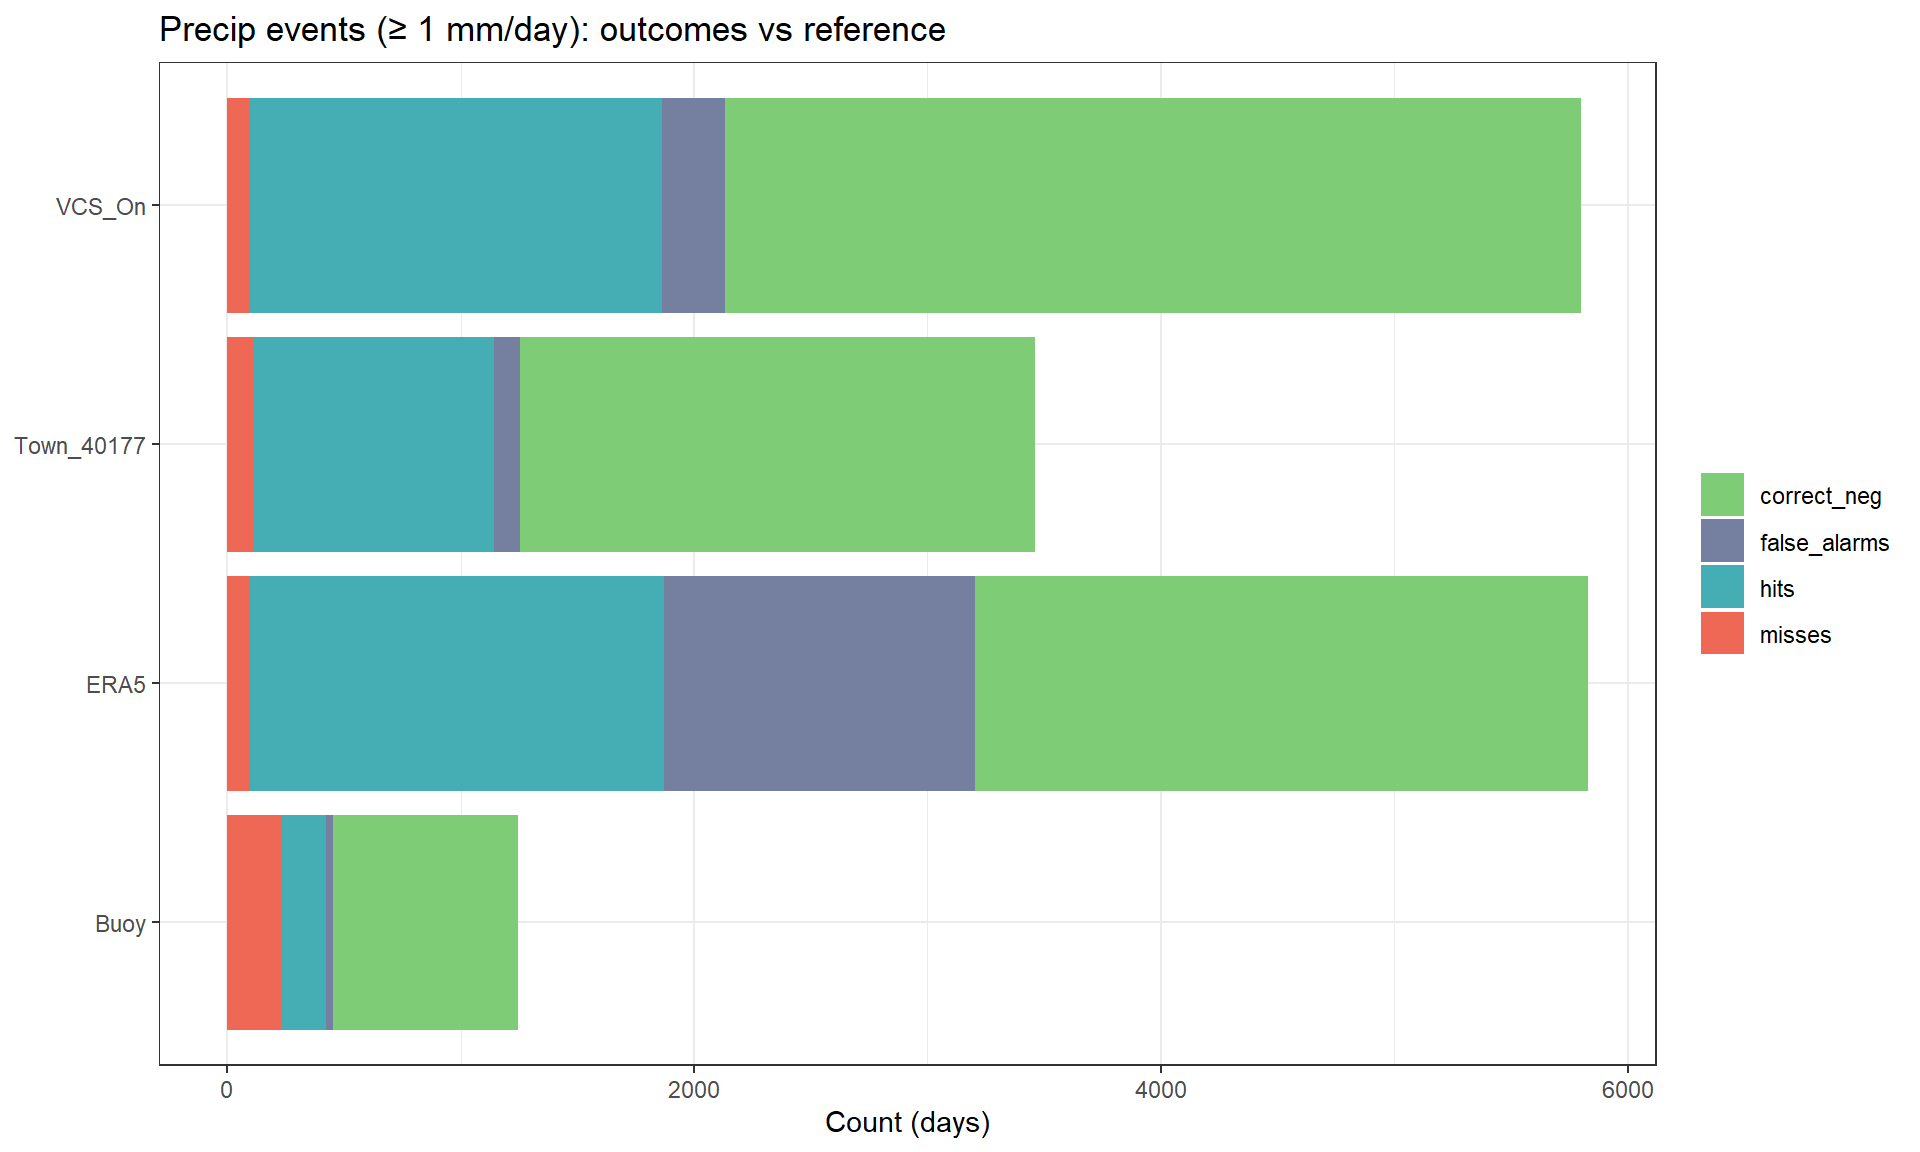
ERA5 produces many hits but also the largest false‑alarm count, while Town_40177 shows the most balanced outcomes (high hits, low false alarms). VCS_On is conservative (few false alarms but more misses), and Buoy has fewer hits overall.
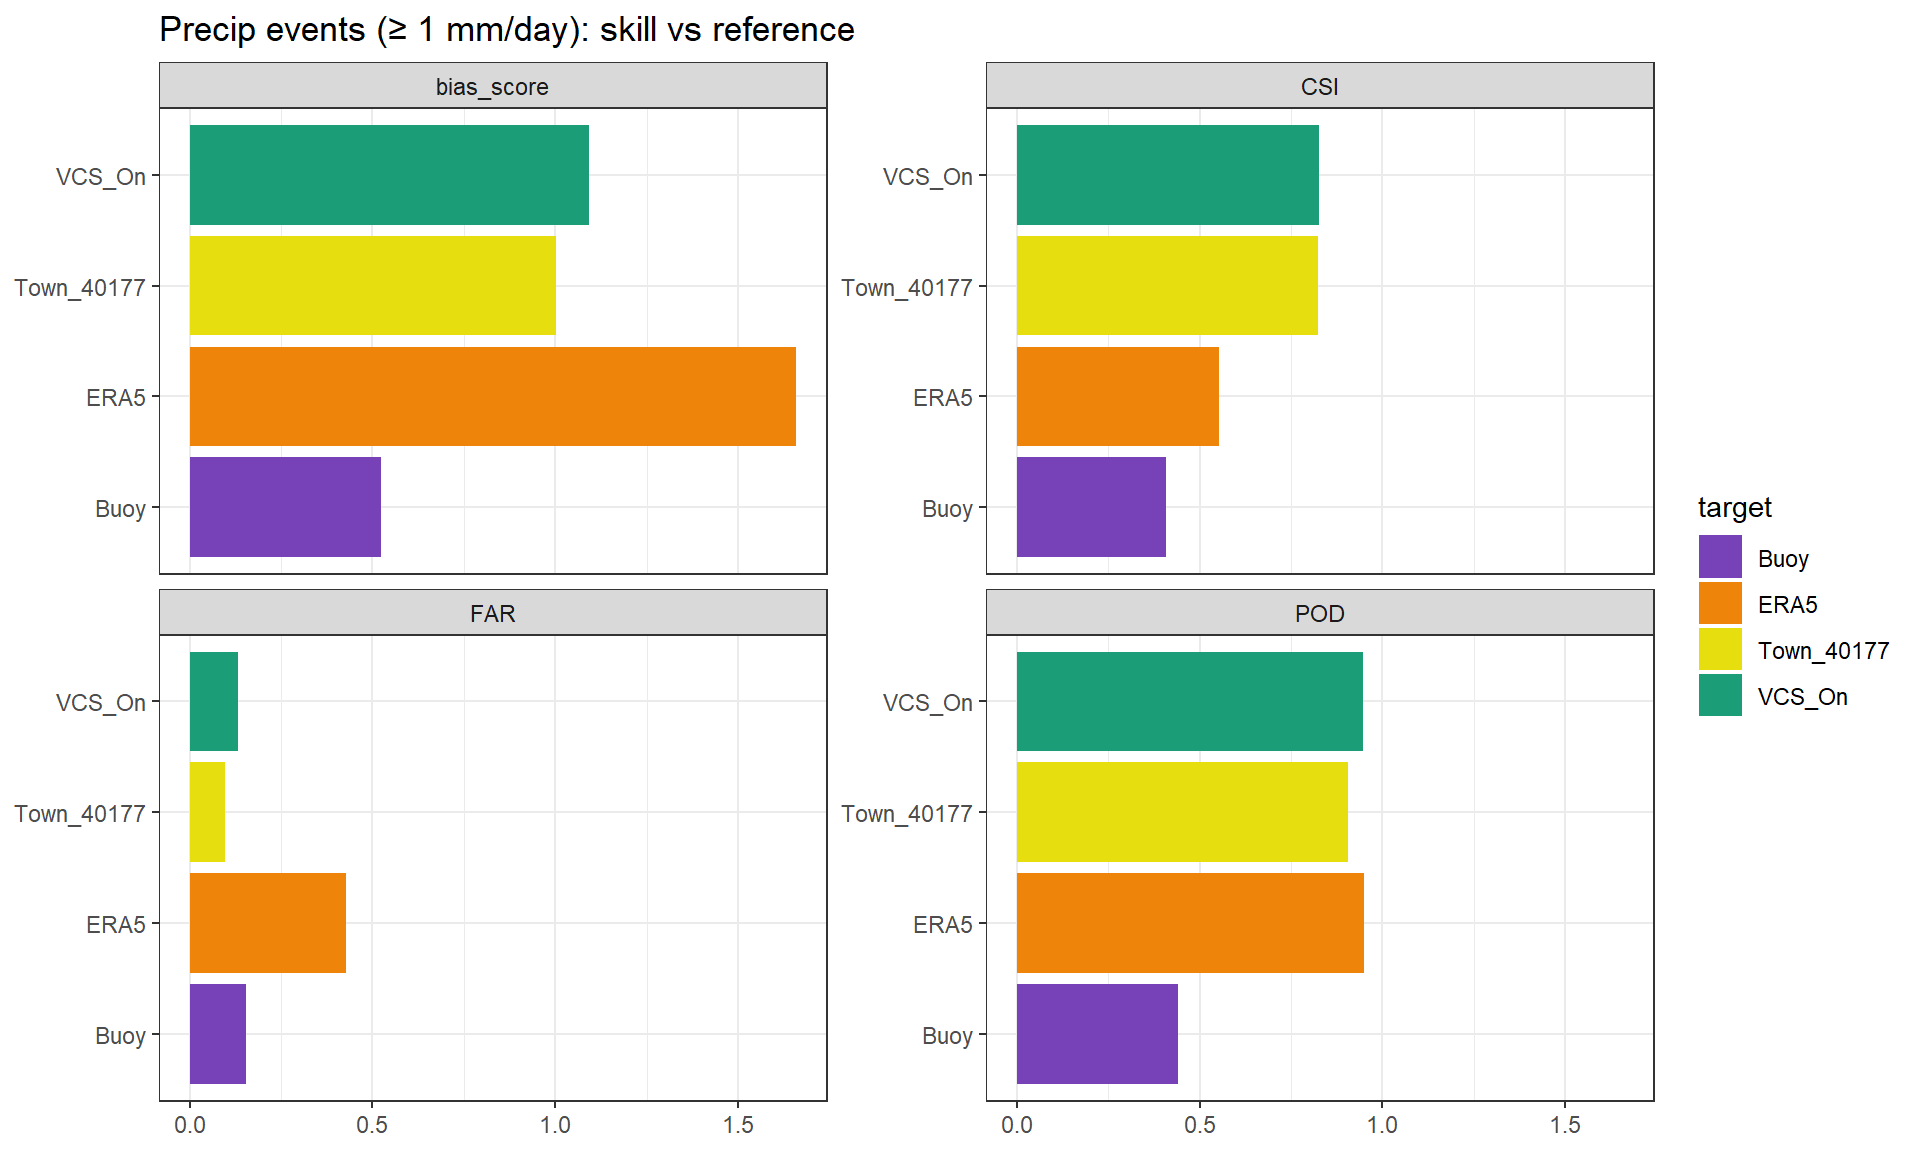
Town_40177 has the highest critical sucess index (CSI) score and low ralse alarm ratio (FAR), indicating the most robust event agreement. ERA5 shows the highest probability of detection (POD), but also the highest FAR and bias_score (>1), showing its over prediction nature. VCS_On shows low FAR and lower POD, while the Buoy data has the weakest skill overall, but also the lowest overall counts compared to the reference.
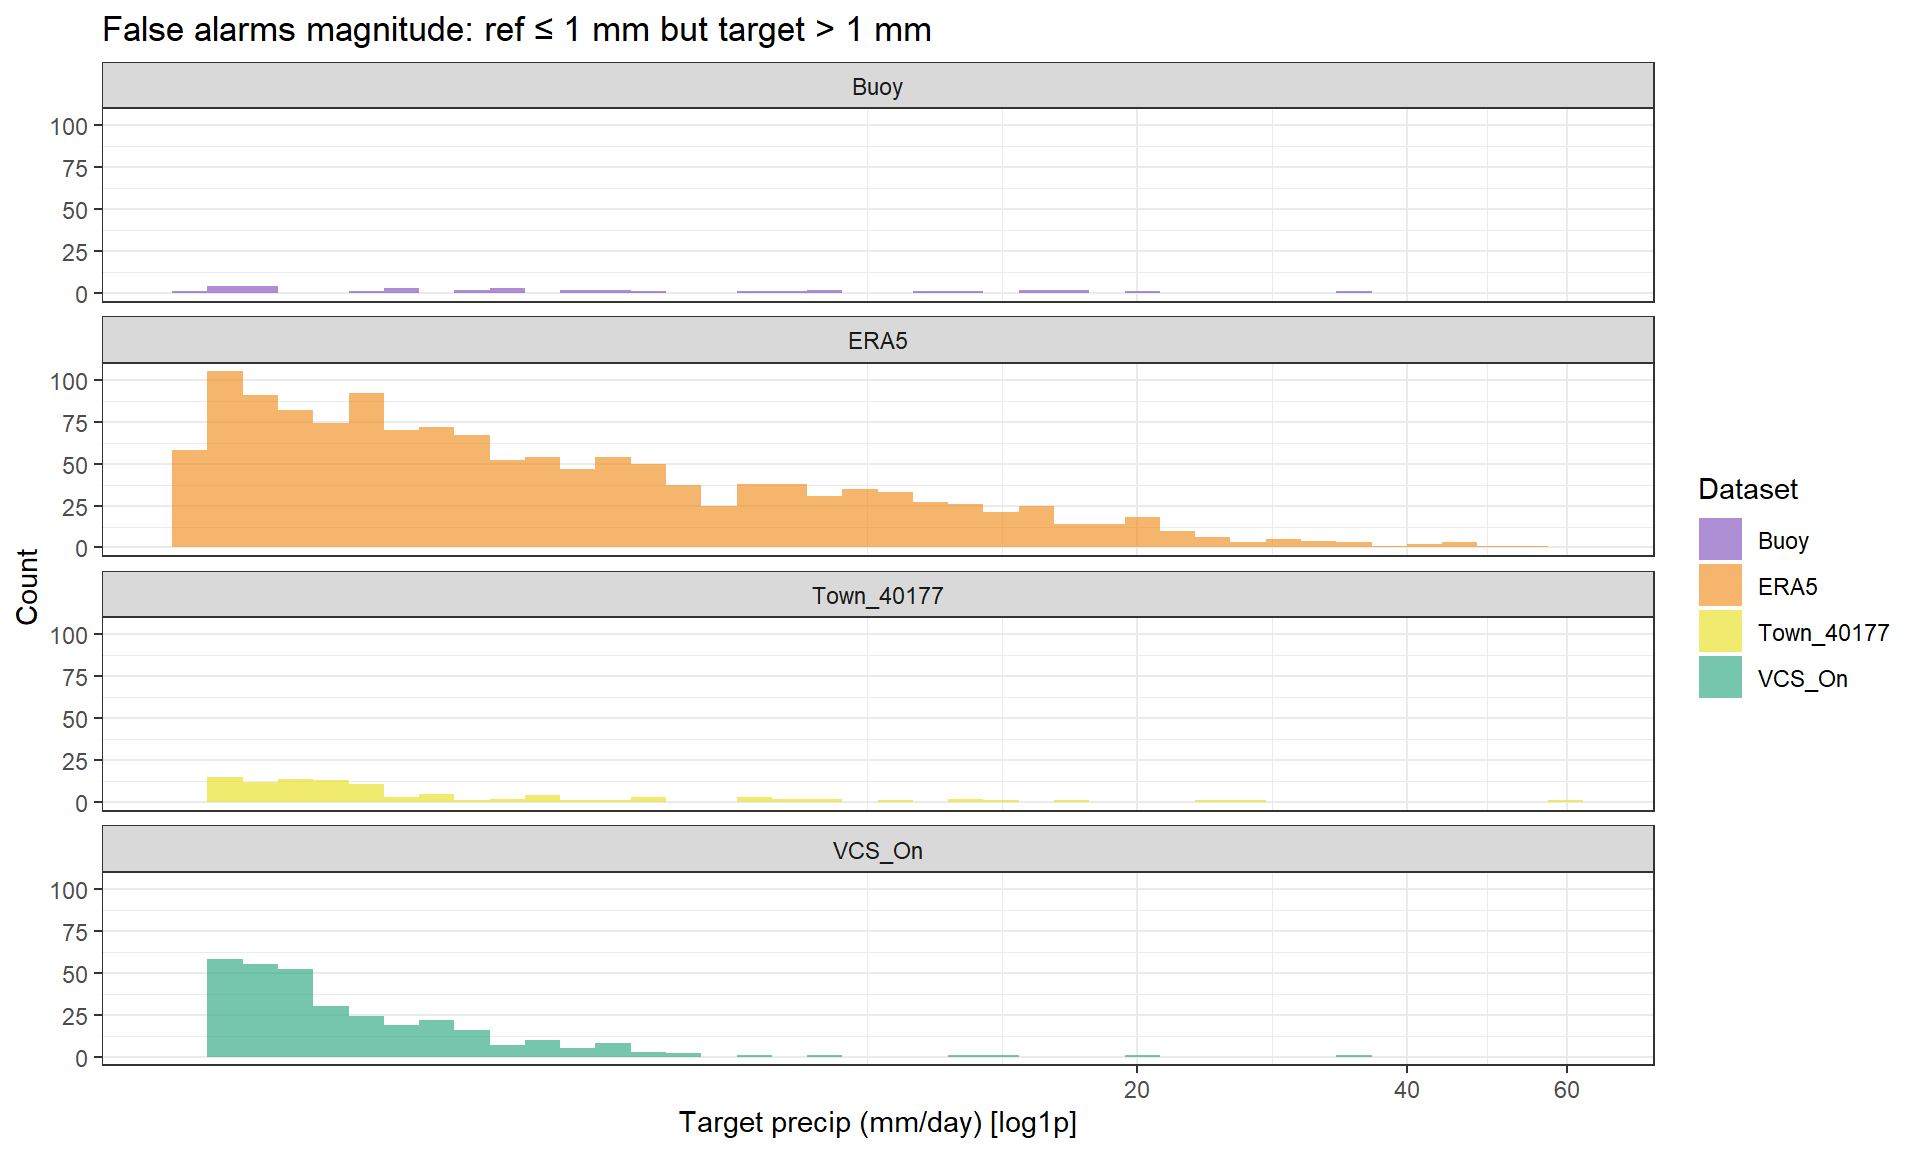
ERA5 shows the largest and most frequent false alarm magnitudes, while Town_40177 and VCS_On are more constrained. Buoy contributes few false alarms but also fewer detected events overall.
ERA5 VCS and Town all have a bias score 1 or >1 and 0.9 or greater POD, indicating over prediction of rain (more false alarms), while the Buoy data has lower bias score (0.52) and POD (0.44) showing it underpredicts rain events. Even thought ERA5 had the highest POD it also had the highest FAR (0.42) while VCS has the lowest FAR and strongest CSI (0.827). Town also produced a strong CSI (0.824) while ERA5 and Buoy both have weak to moderate scores.
Seasonal behaviour
Climatology and seasonal bias plots show potential detection or lack of for extremes across the year.
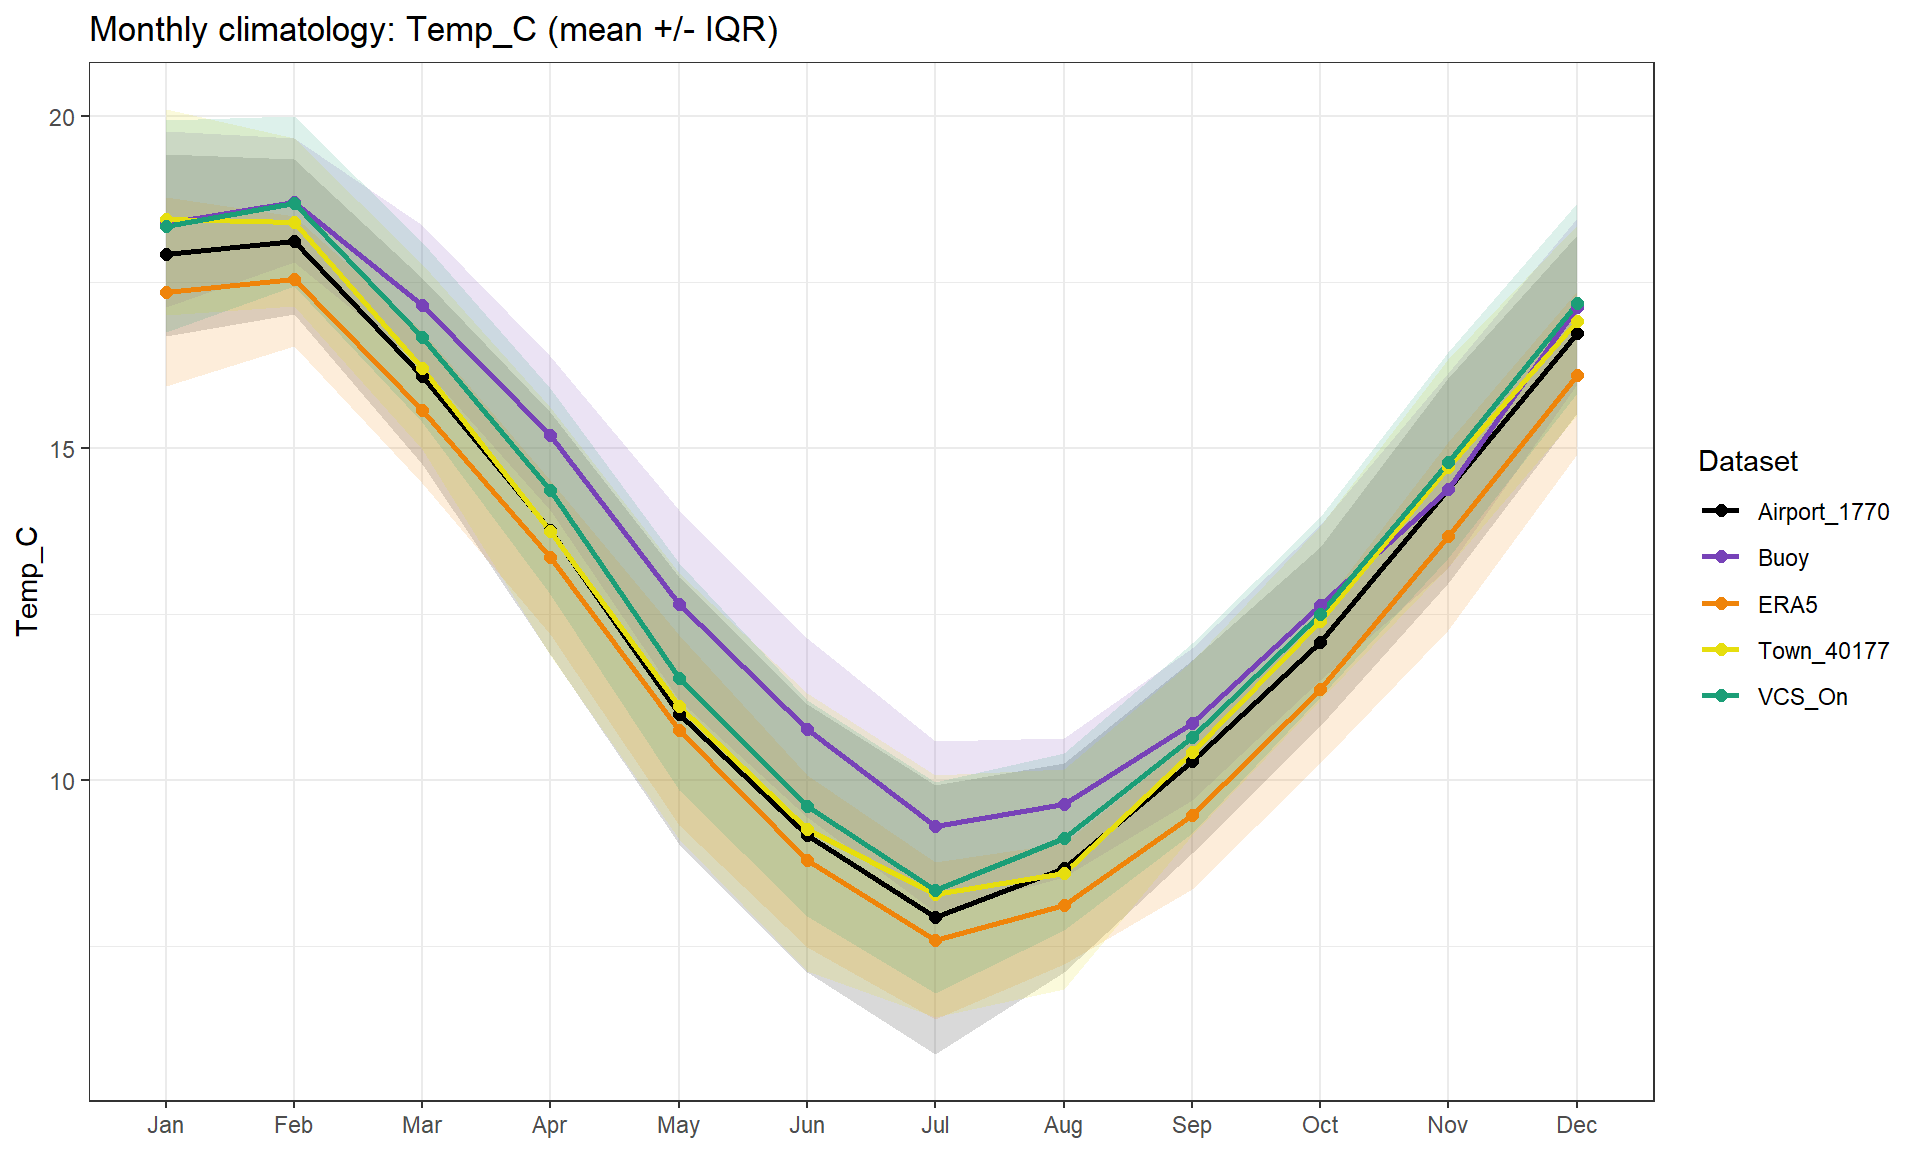
All datasets reproduce the same seasonal cycle (summer peak, winter minimum). ERA5 is consistently cooler than the reference, while Buoy and VCS_On are warmer. Town_40177 tracks the airport most closely across all months. IQR bands broadly overlap, indicating similar seasonal variability, but the persistent offsets indicate systematic seasonal bias rather than random error.
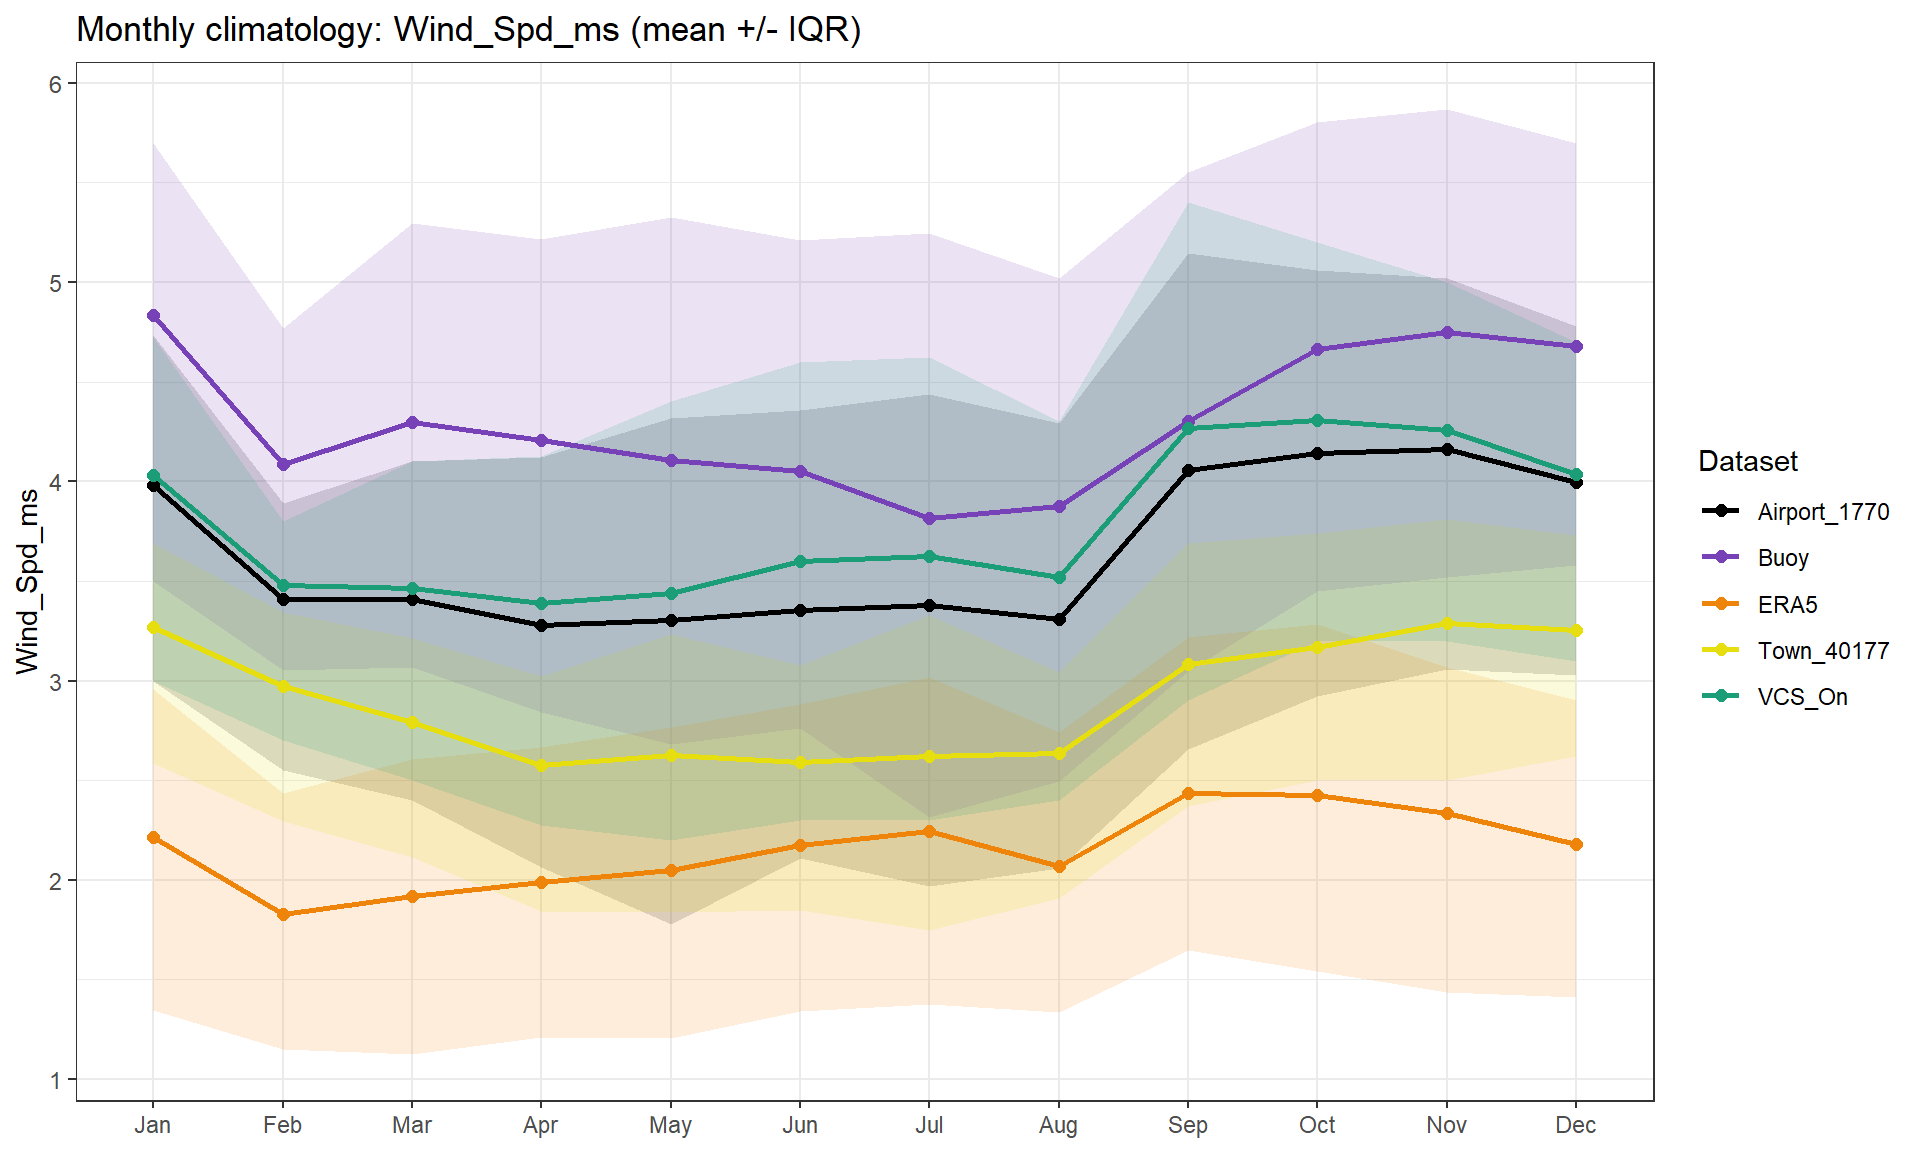
All datasets show higher winds in spring and summer and lower in winter, but the magnitude differs. ERA5 is consistently lower than the reference across all months (systematic low bias). Buoy and VCS_On are higher than the reference, while Town_40177 is lower. The VCS_On bands are closest to the reference, The thisckness in the IQR bands suggest greater variation or local effects.
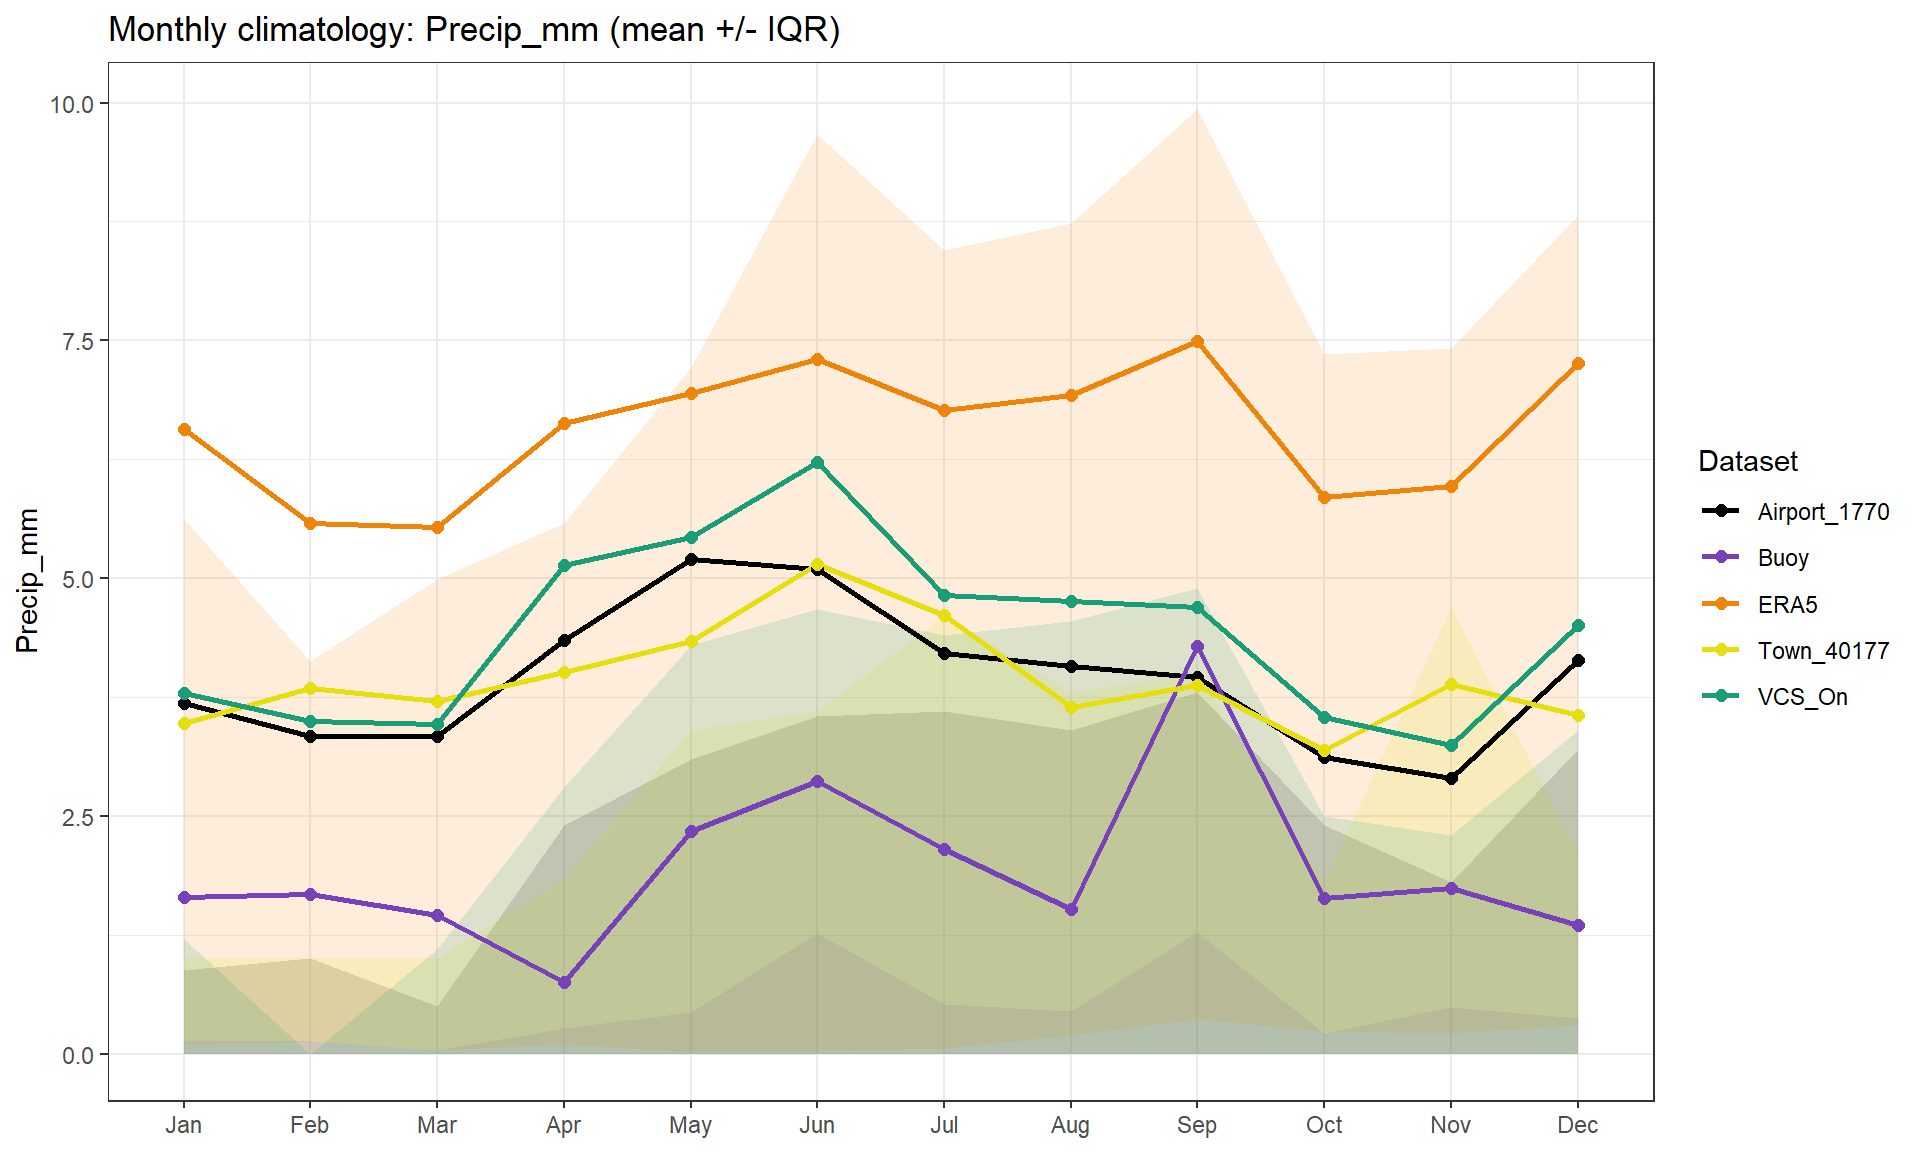
All datasets show a winter spring increase and a relative summer decrease, but the magnitude differs substantially. ERA5 is consistently wetter than the reference across months, while Buoy is clearly drier exept for september. Town_40177 aligns closely with the airport, and VCS_On is slightly wetter in several months but closer in the warmer dryer parts of the year. Wider IQRs for ERA5 indicate more variability and heavier tails.
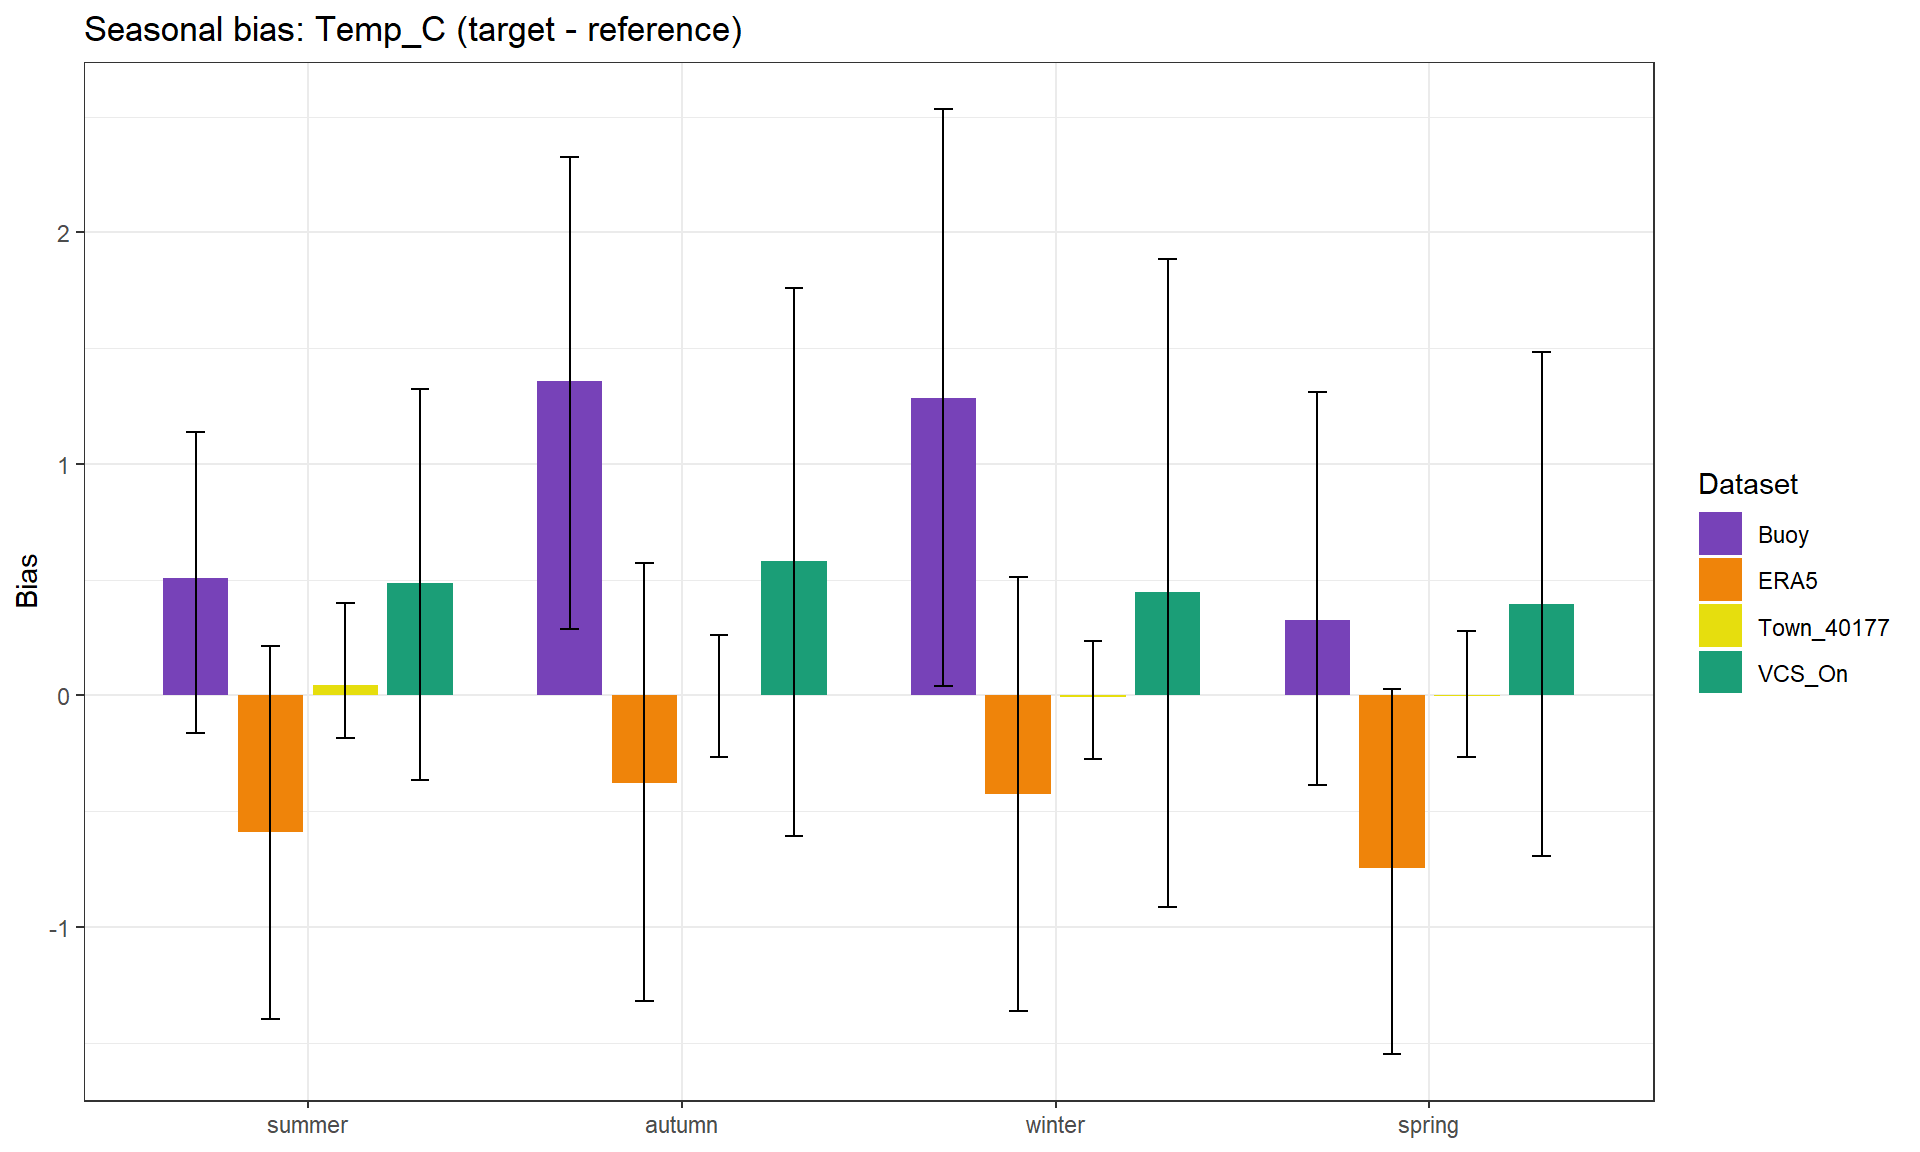
ERA5 is cool biased in all seasons, most pronounced spring. Buoy shows a warm bias in all seasons, especially autumn/winter. Town_40177 is near zero in every season (best match). VCS_On is consistently warm biased but smaller than Buoy.
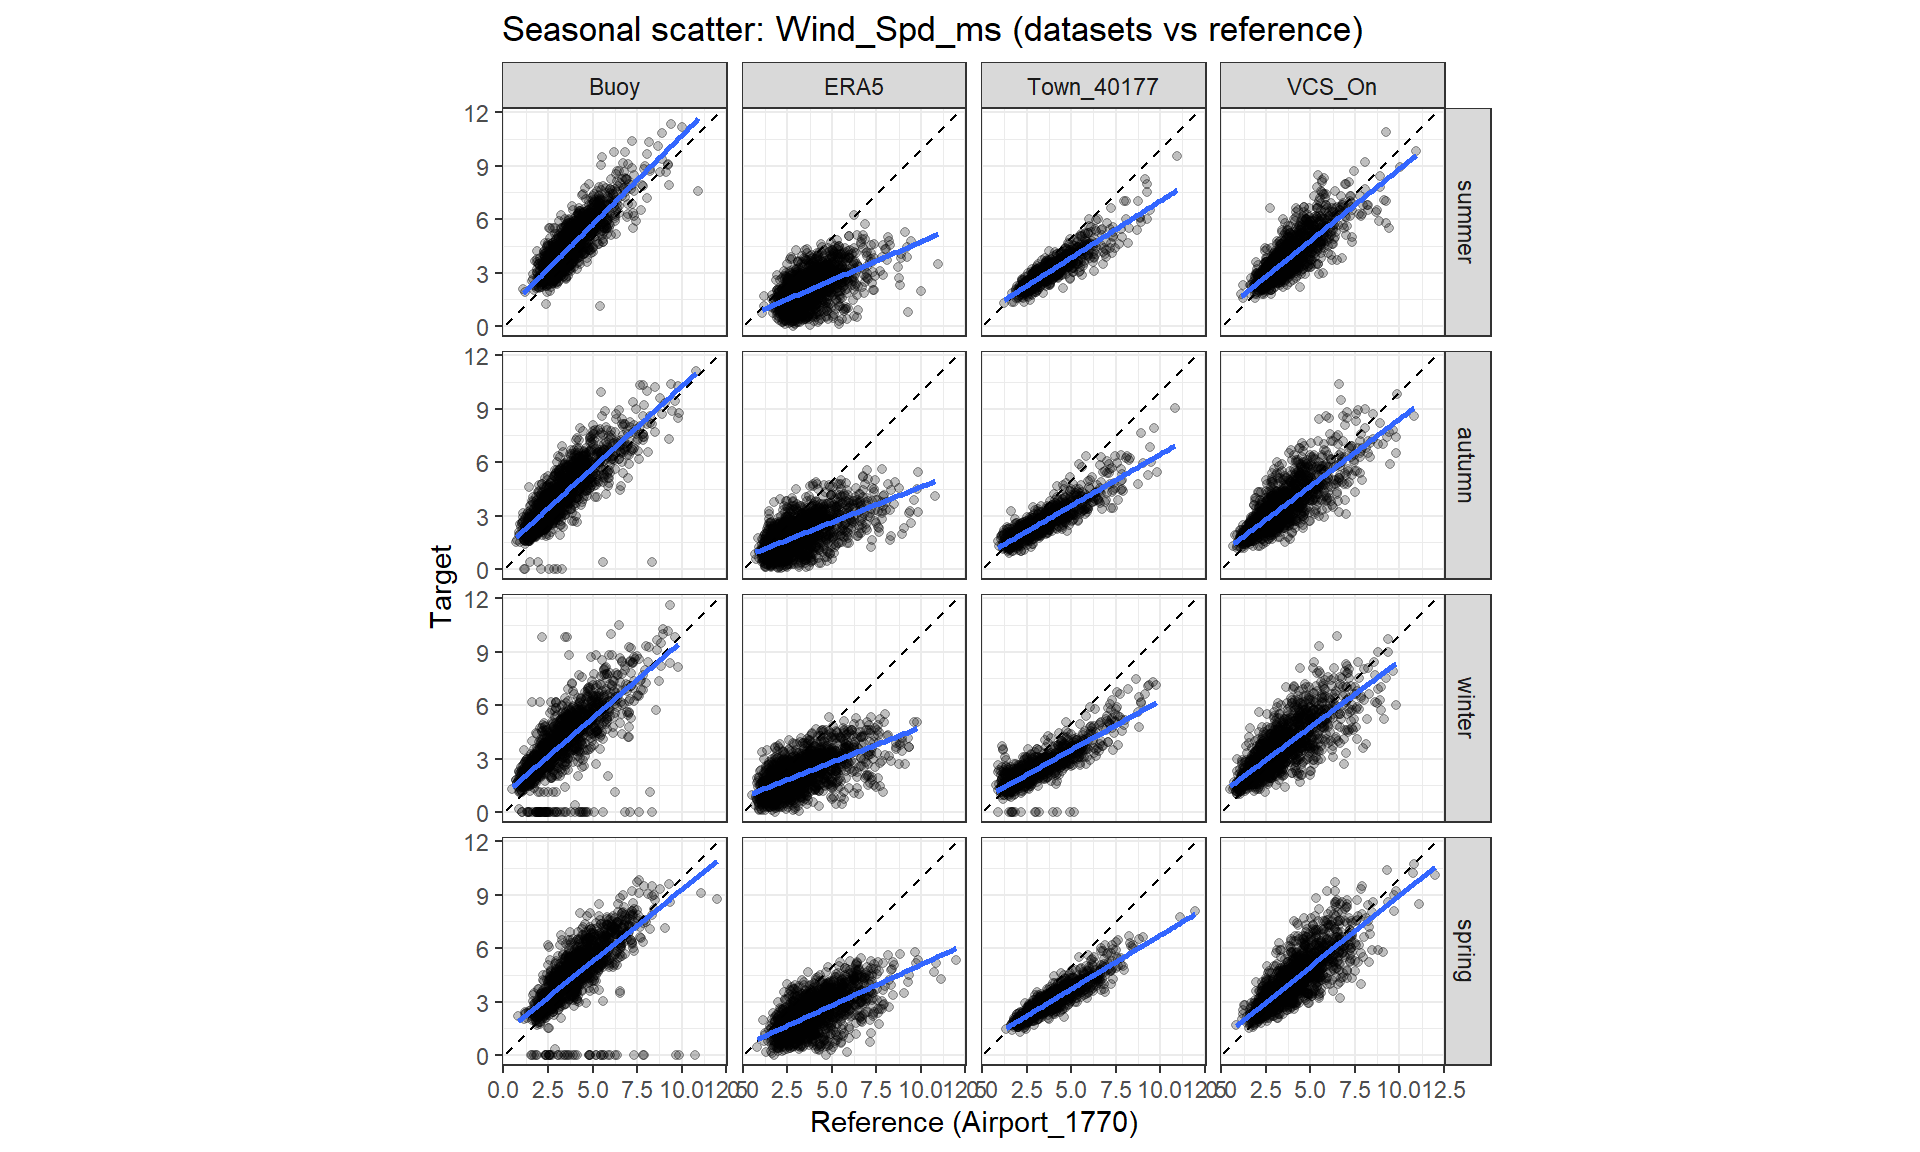
Town_40177 and VCS_On show tighter clustering around the 1:1 line across seasons, indicating stronger agreement. ERA5 shows systematic underestimation (regression slope < 1) in all seasons, especially at higher winds. Buoy shows reasonable agreement but with more spread in summer and spring.
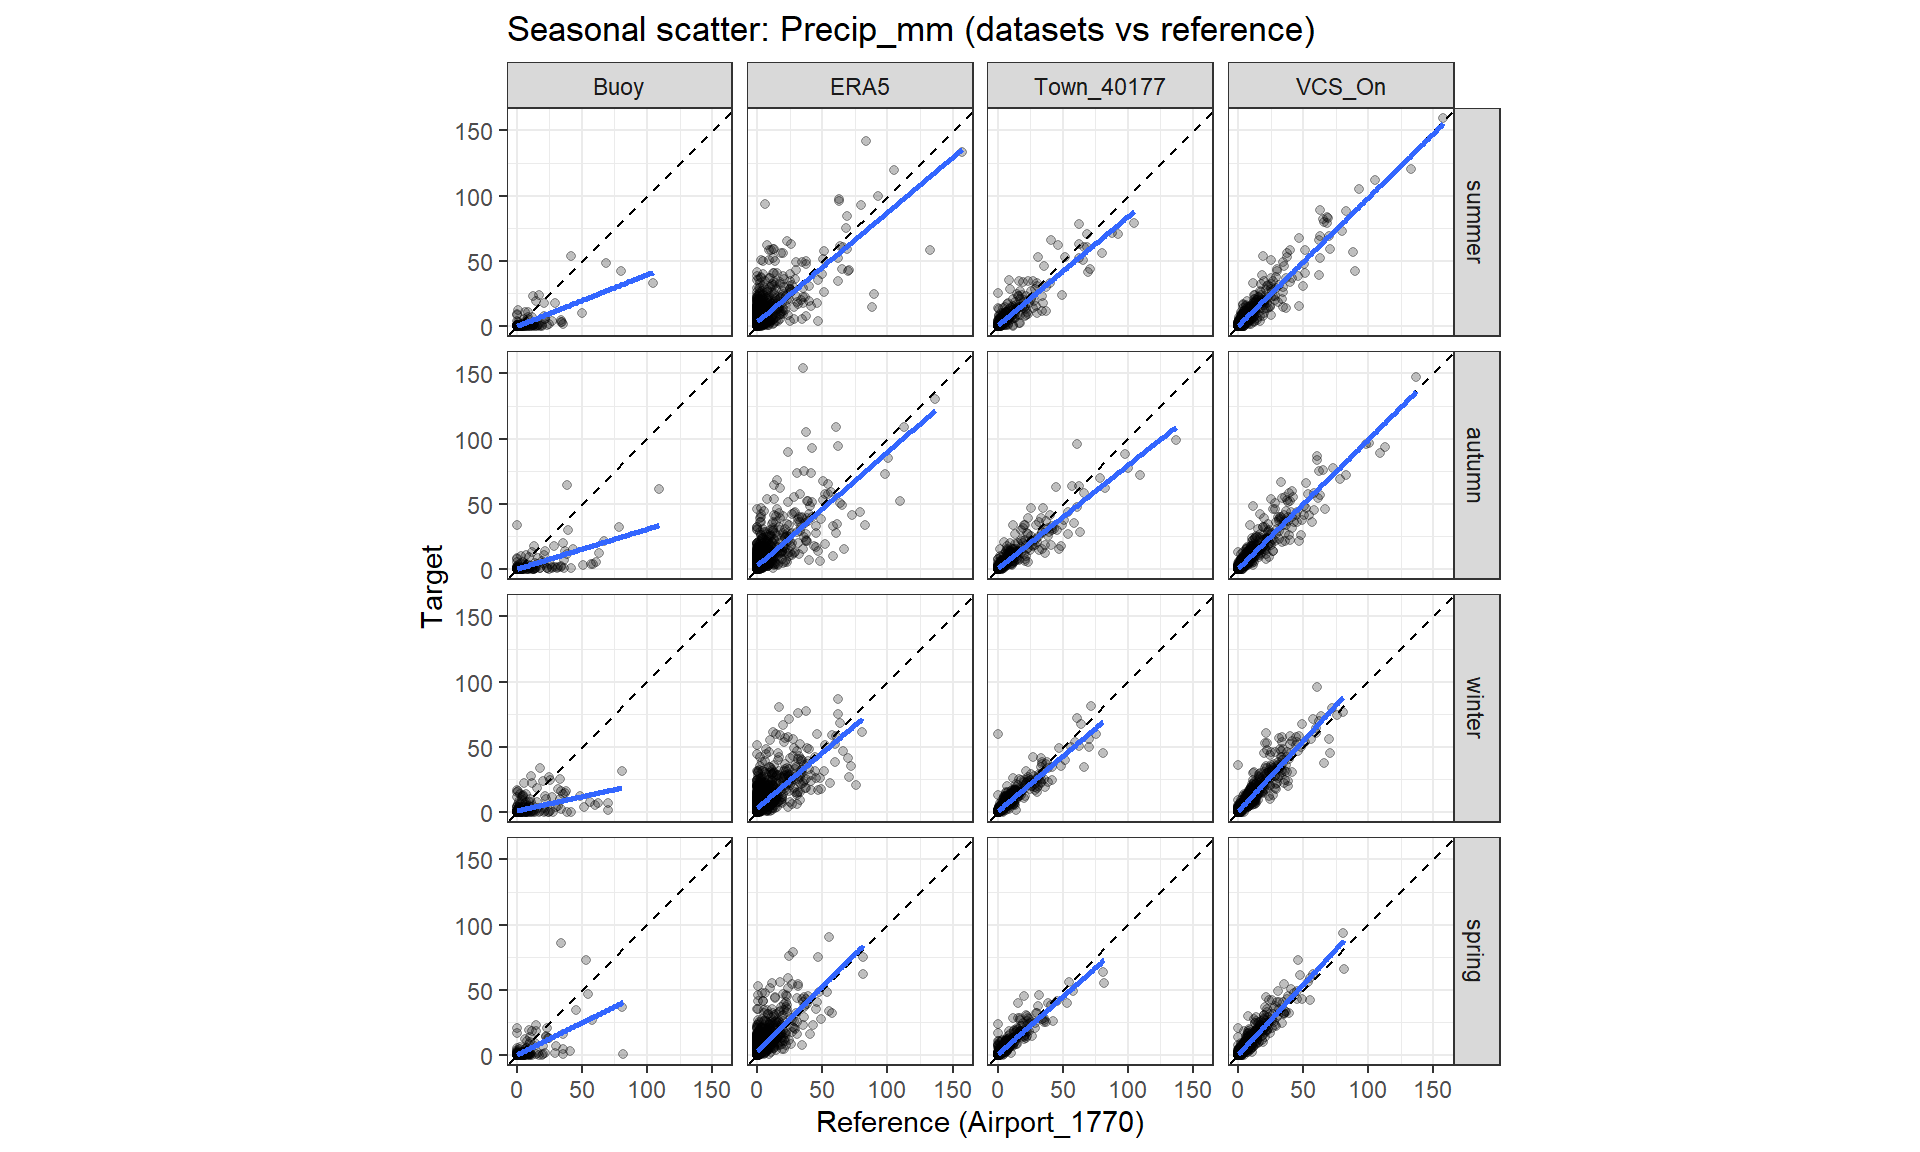
VCS_On are closest to the 1:1 line in all seasons, indicating the best precipitation agreement. Town and ERA5 tends to overestimate moderate and heavy events (slope > 1), while Buoy underestimates rainfall across seasons and shows the greatest dispersion at higher totals.