Metrics and Statistics
This tab gathers the quantitative diagnostics (coverage, MAE/RMSE/CCC/bias, distributions, scatter, rolling drift). Use it when you want numbers and concise plots for statistical agreement analysis.
Coverage summary
Metrics table (MAE, RMSE, CCC, bias)
Includes all days plus wet-day and windy-day subsets where relevant. Sort/filter to focus on a variable (var) or subset.
Temperature (Temp_C)
Town_40177 shows near‑perfect agreement with Airport_1770 (r=0.99, RMSE=0.48, bias=0.01). ERA5 is strong but cool‑biased (r=0.95, RMSE=1.42, bias −0.53). Buoy and VCS_On are similar in correlation (r=0.92 and 0.91) with slight warm biases (bias +0.87 and +0.48, RMSE ~1.8). Overall high agreeability across all datasets with = or > 0.90 CCC score.
Precipitation (Precip_mm)
VCS_On and Town_40177 show the best overall agreement for all days (r=0.95 and 0.93; RMSE 3.68 and 4.08; CCC=0.94 and 0.92), with small biases. ERA5 shows lower performance but overestimates rain (r=0.74, RMSE=8.87, bias +2.62; CCC=0.71). Buoy performs weakest (r=0.61, RMSE=10.03, bias −2.99) with low agreement (CCC=0.49). On wet days (>1 mm), performance drops for all datasets; VCS_On remains highest (r=0.93, RMSE=6.48), Town_40177 is close (r=0.91, RMSE=6.83), while ERA5 lowers in agreement (CCC=0.65) and Buoy show the lowest agreement (CCC=0.40).
Wind speed (Wind_Spd_ms)
On all days, VSC_On shows the highest agreement (CCC=0.82) with the lowest MAE (0.7) and RMSE (0.93). Town_40177 has the highest correlation (r=0.88) with a CCC of 0.70, but a negative bias (−0.81); VCS_On has the lowest RMSE (0.93) and near‑zero bias (+0.14). Buoy is moderate (r=0.78, RMSE=1.29, bias +0.65) with the second highest CCC (0.72). ERA5 is weakest (r=0.61, RMSE=1.95, bias −1.49) with the lowest CCC (0.03). In the top 10% windy subset, all datasets reduce sharply; Town_40177 retains the highest r (0.73) but still underestimates extremes. VCS_On has the lowest RMSE (1.50), Buoy is weakly correlated, and ERA5 performs poorest (r=0.20, RMSE=3.71, bias −3.46).
Distribution and bias shape
Density distribution overlays show bias or spread differences
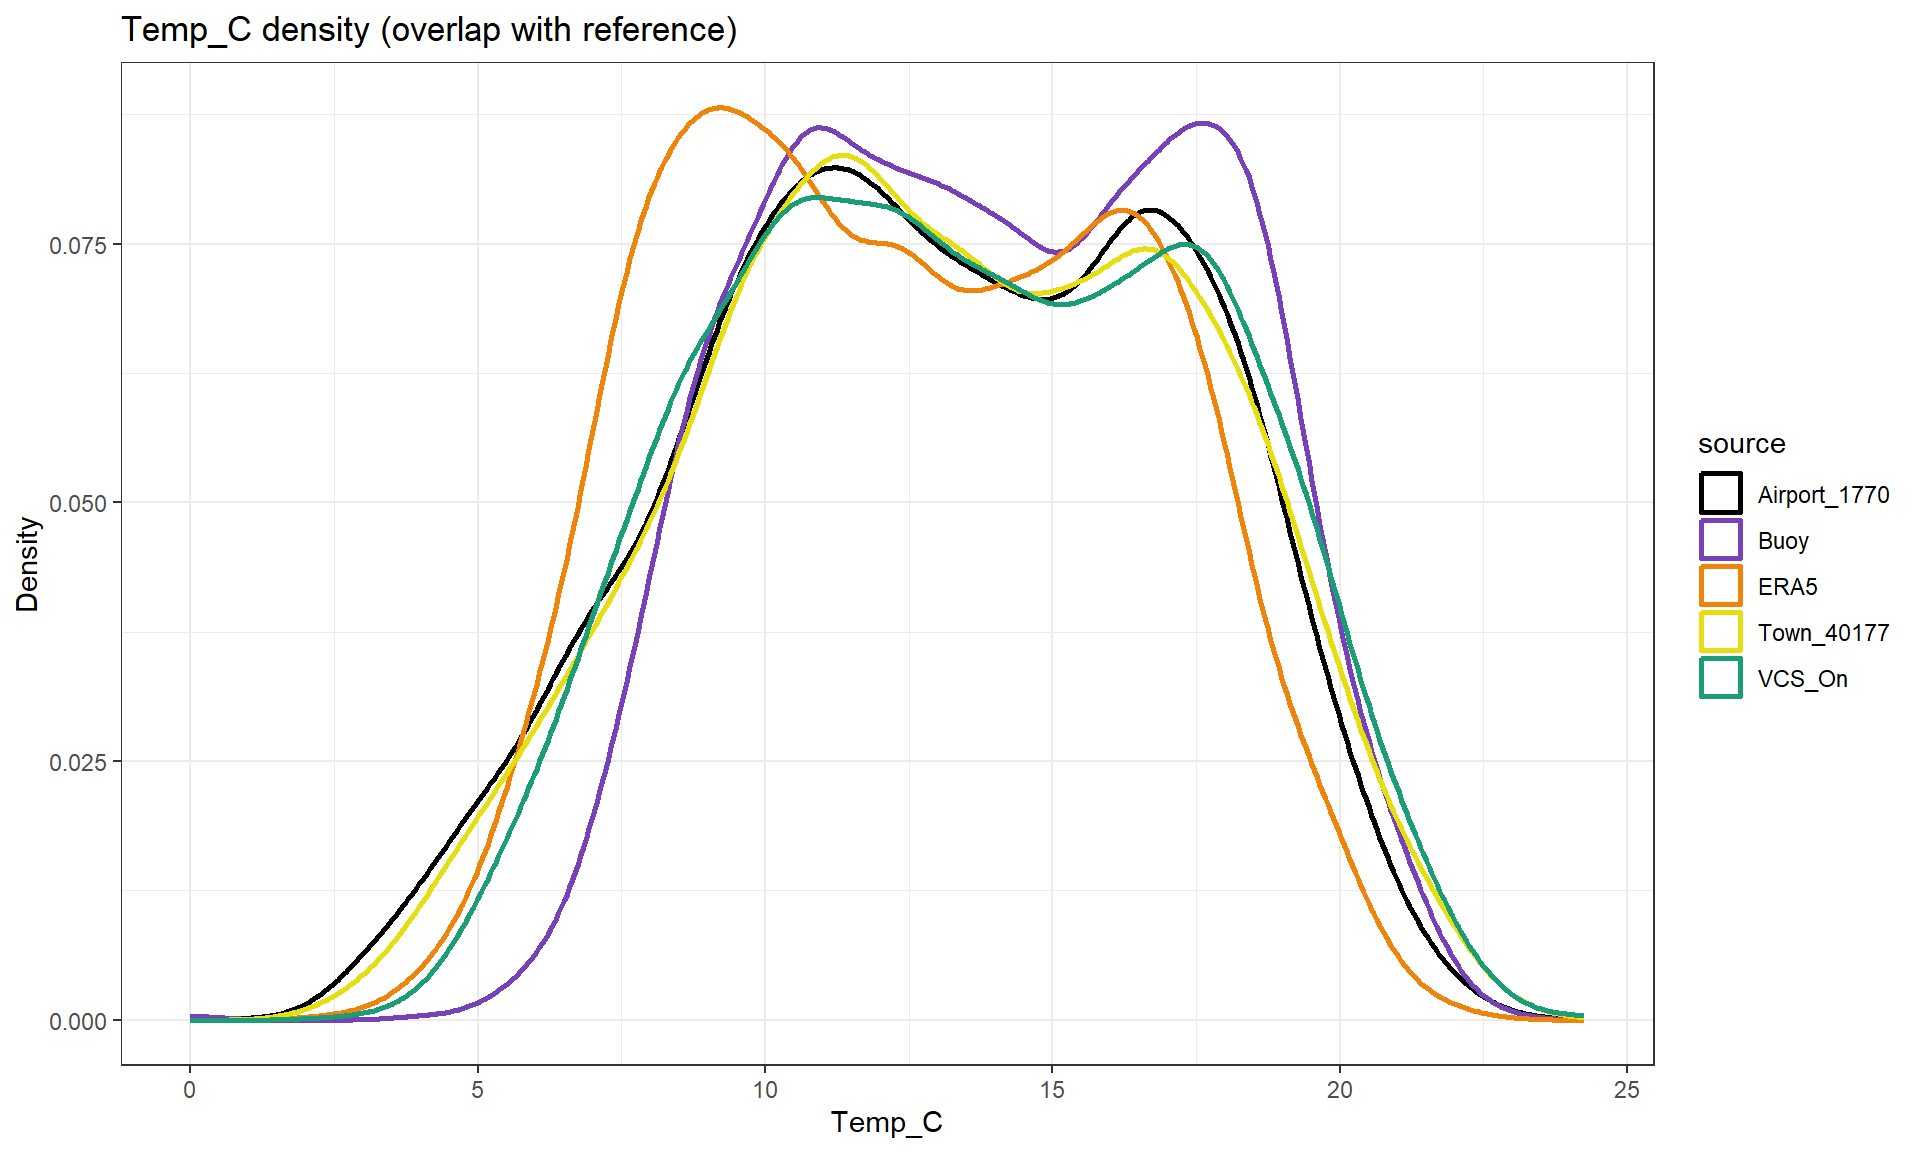
The distributions are broadly similar with a classic bimodal structure, but ERA5 is shifted slightly cooler (left of the reference) with the only hint of a multimodal structure forming at around 12 degrees. Buoy and VCS_On are shifted warmer (right of the reference). Buoy shows a consistant hihger density of temperature between 10 and 20 degrees but has the lowest cooler density below 7.5 degrees. Town_40177 most closely overlaps the reference distribution. Differences in tail thickness suggest small changes in variability, but the overall temperature range is consistent.
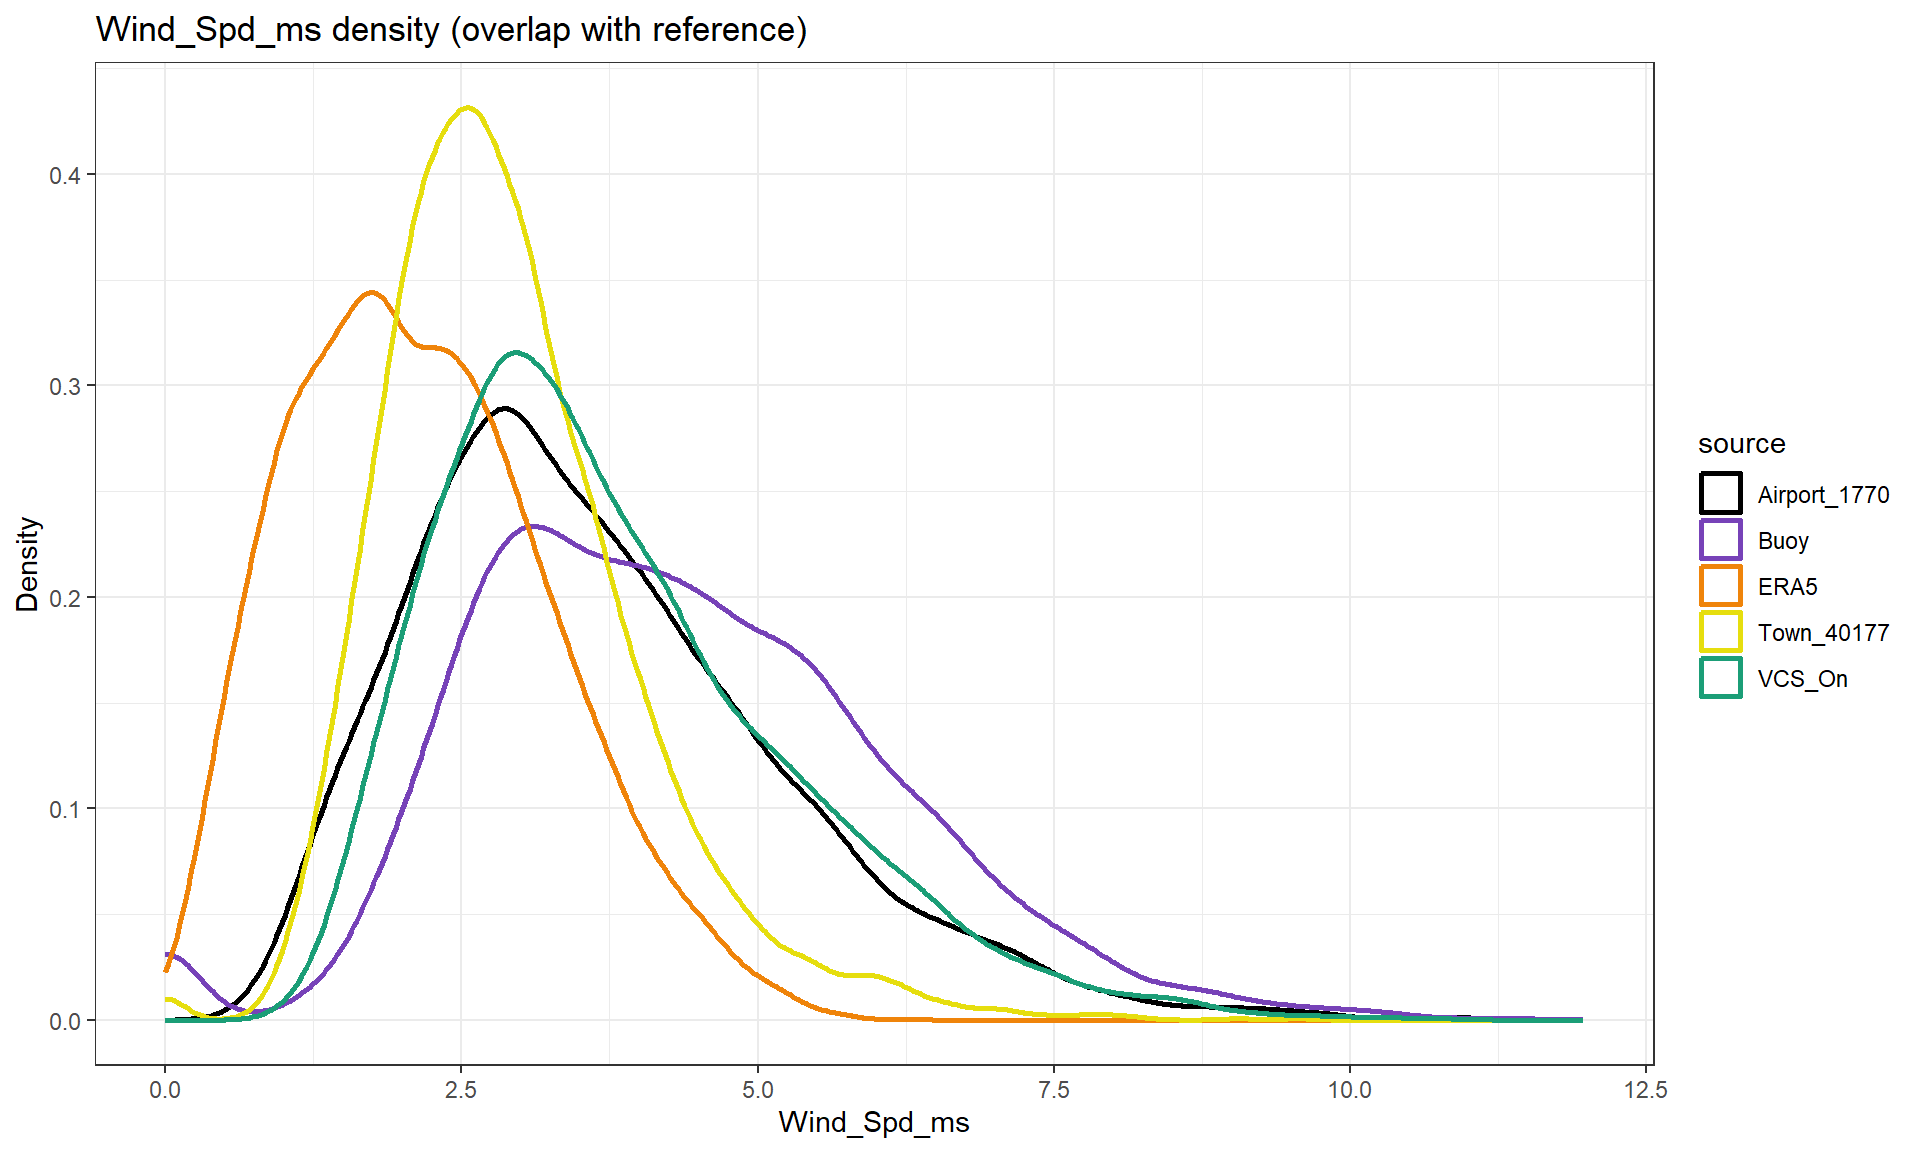
ERA5 is shifted to lower wind speeds (left) with a longer tail and a less defined unimodal shape, showing a consistent low‑wind bias. Buoy and VCS_On are shifted to the right with have higher density right tails (higher wind) than the reference, particulary the Buoy hold a stronger density showing higher frequency of moderate–strong winds measurments (high variability). Town shows less wind variability compared to the other datassets.
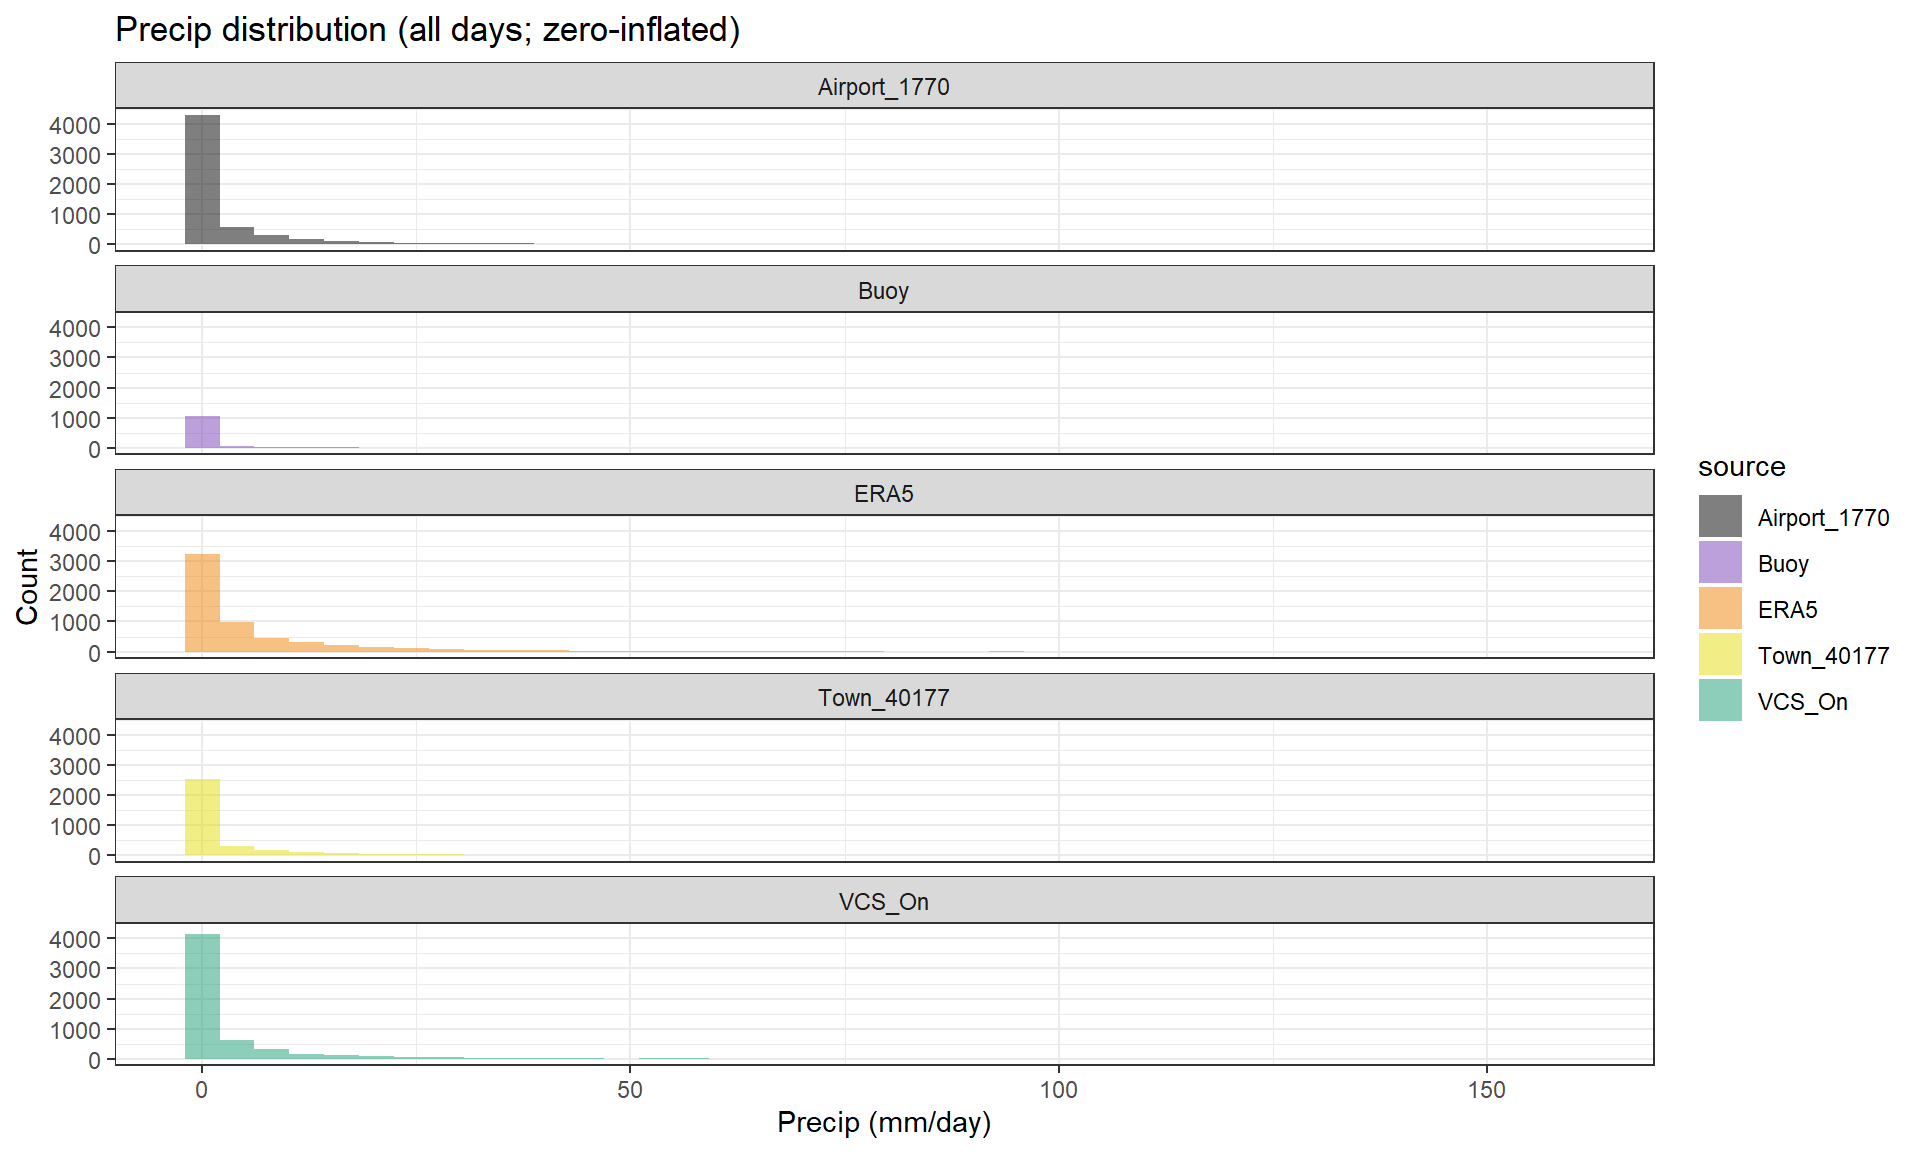
All datasets are strongly zero‑inflated, but ERA5 shows a longer right tail and more moderate rainfall counts that are spread out, consistent with wet bias. Buoy has fewer non zero counts, indicating a lack of precipitation detection. VCS_On is closest to the reference, with similar tails and event frequencies. Town_40177 follows a similar pattern to the reference, but seems to underrepresent rain.
Scatter vs reference (1:1)
Scatter plots to check linear agreement and systematic bias
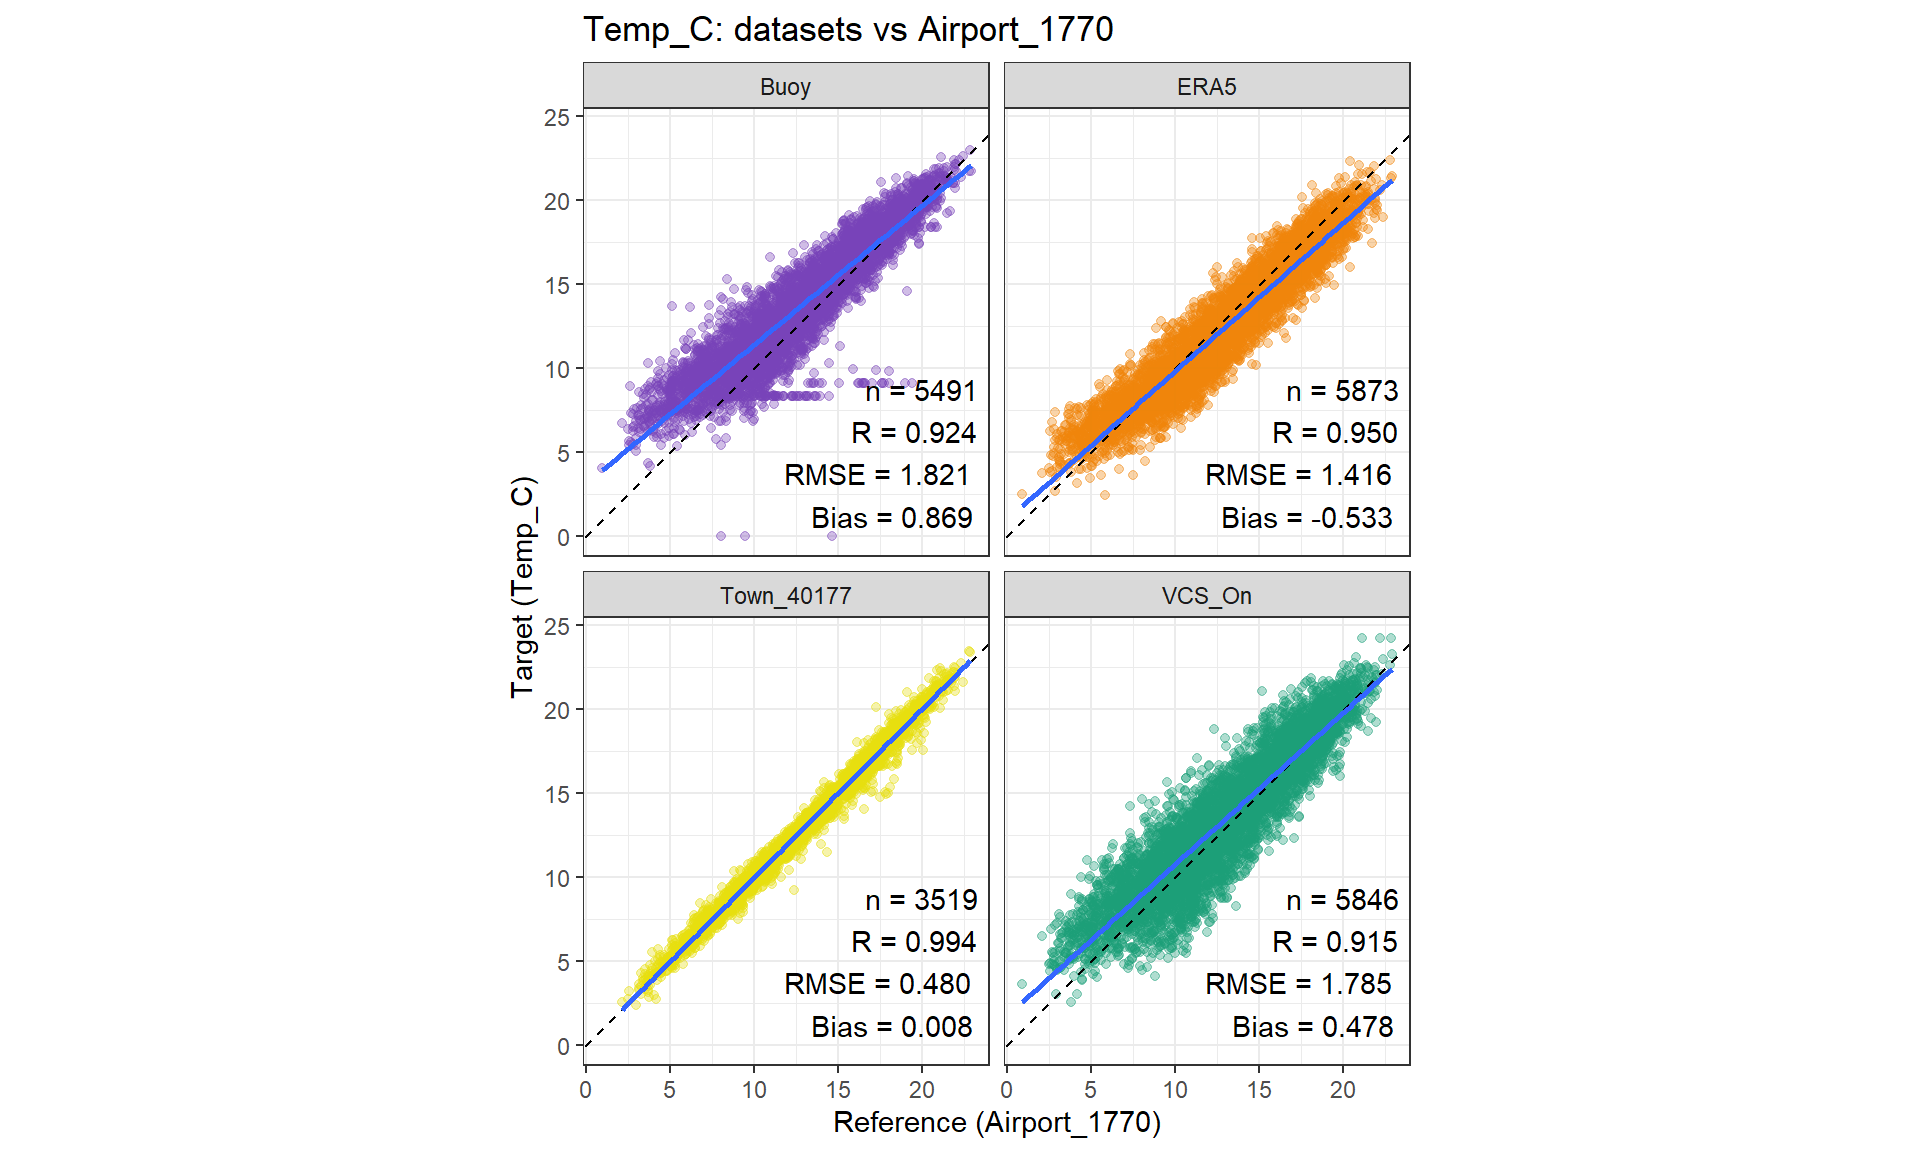
Temperature agreement is strong across all datasets, with near‑linear relationships. Town_40177 has near‑perfect agreement (r≈0.99, very low RMSE and near‑zero bias). ERA5 shows high correlation and low RMSE with a small cool bias. Buoy and VCS_On remain strongly correlated but show warm biases relative to the airport.
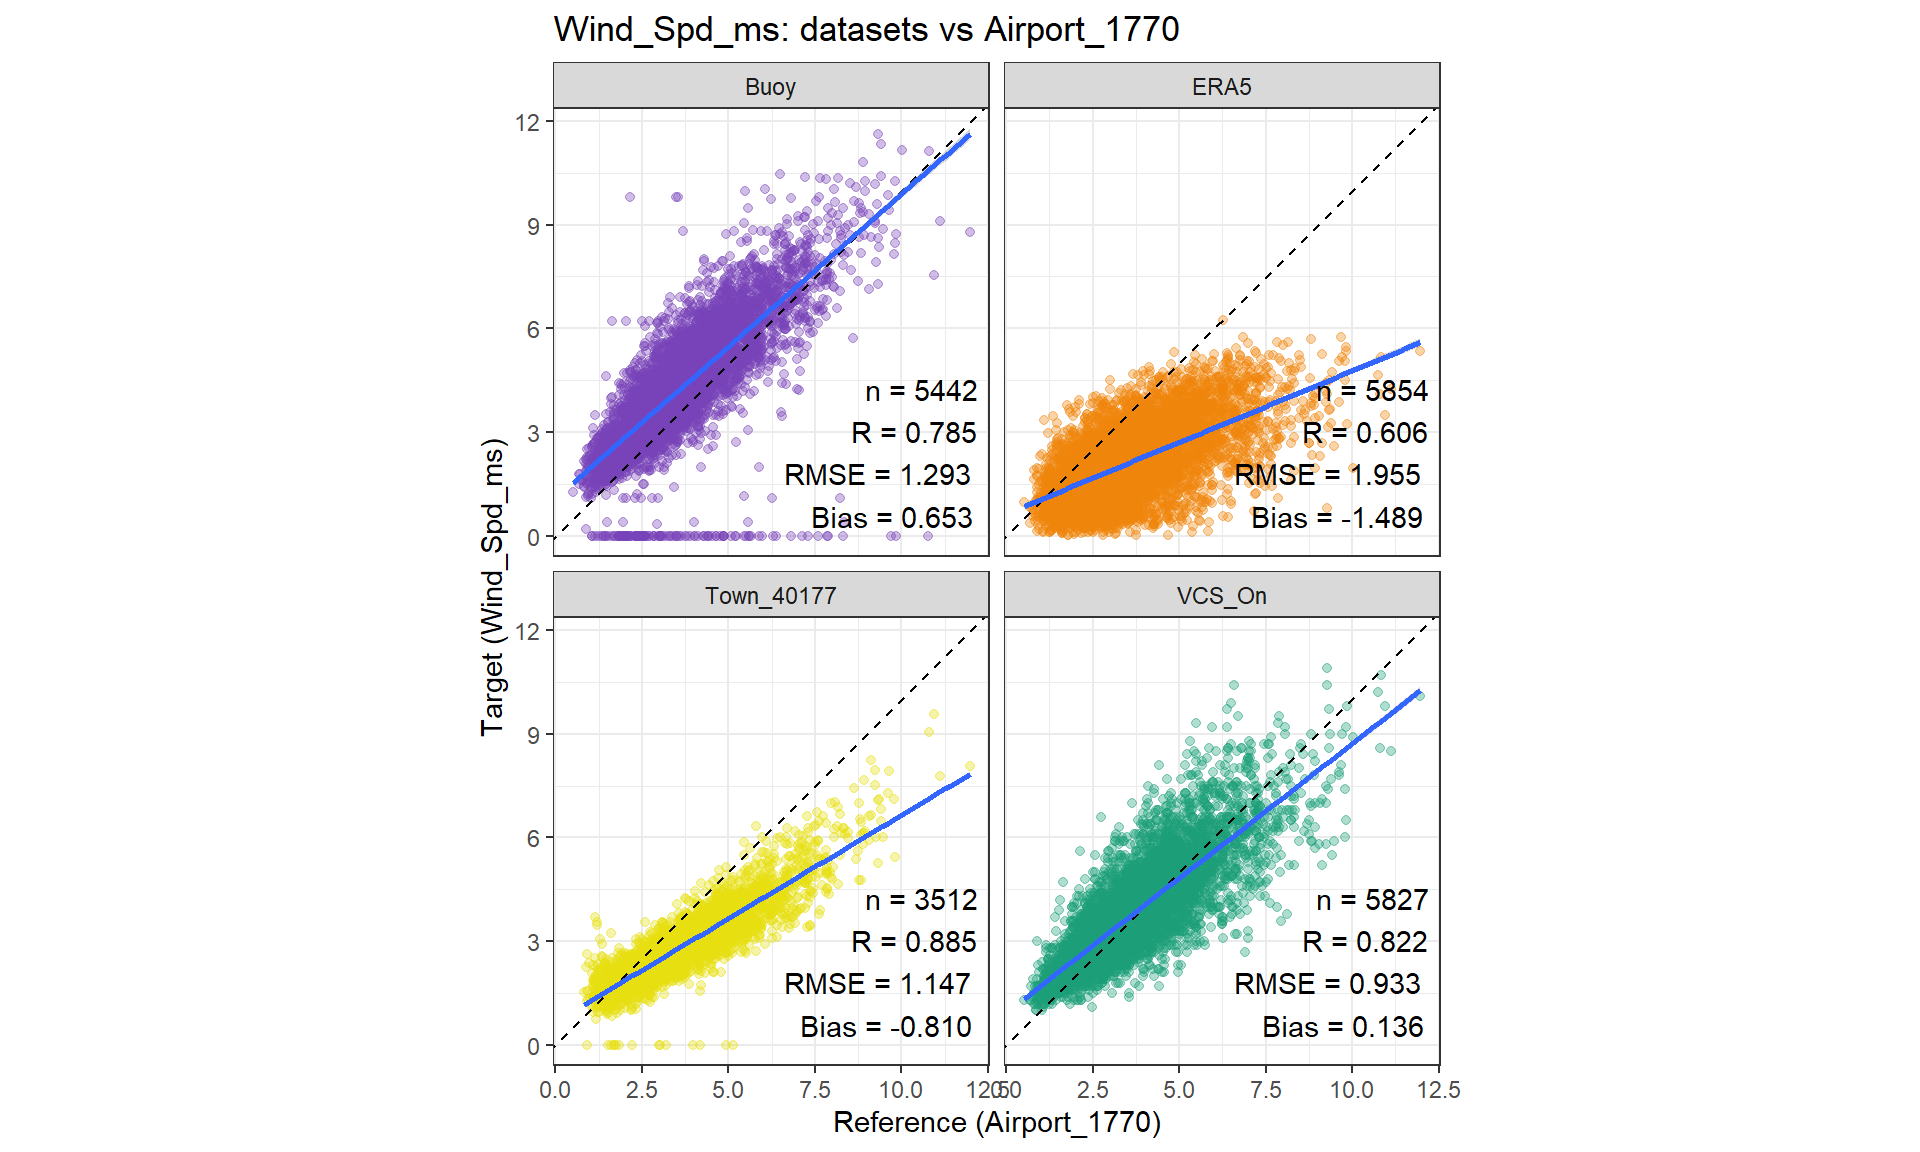
The heteroscedastcity shows errors are not constant but high wind days more uncertanty. All datasets show positive associations with the airport reference, but performance differs. Town_40177 and VCS_On show the strongest correlations and lowest errors, with regression lines closest to the 1:1 line, Town wind is dampened in stronger winds. however, VCS shows Heteroscedasticity. Buoy shows lower but moderate correlation and a positive bias (overestimation), while ERA5 shows weaker correlation and a strong negative bias (underestimation) with the largest RMSE among the four and dampened/smoother higher wimds.
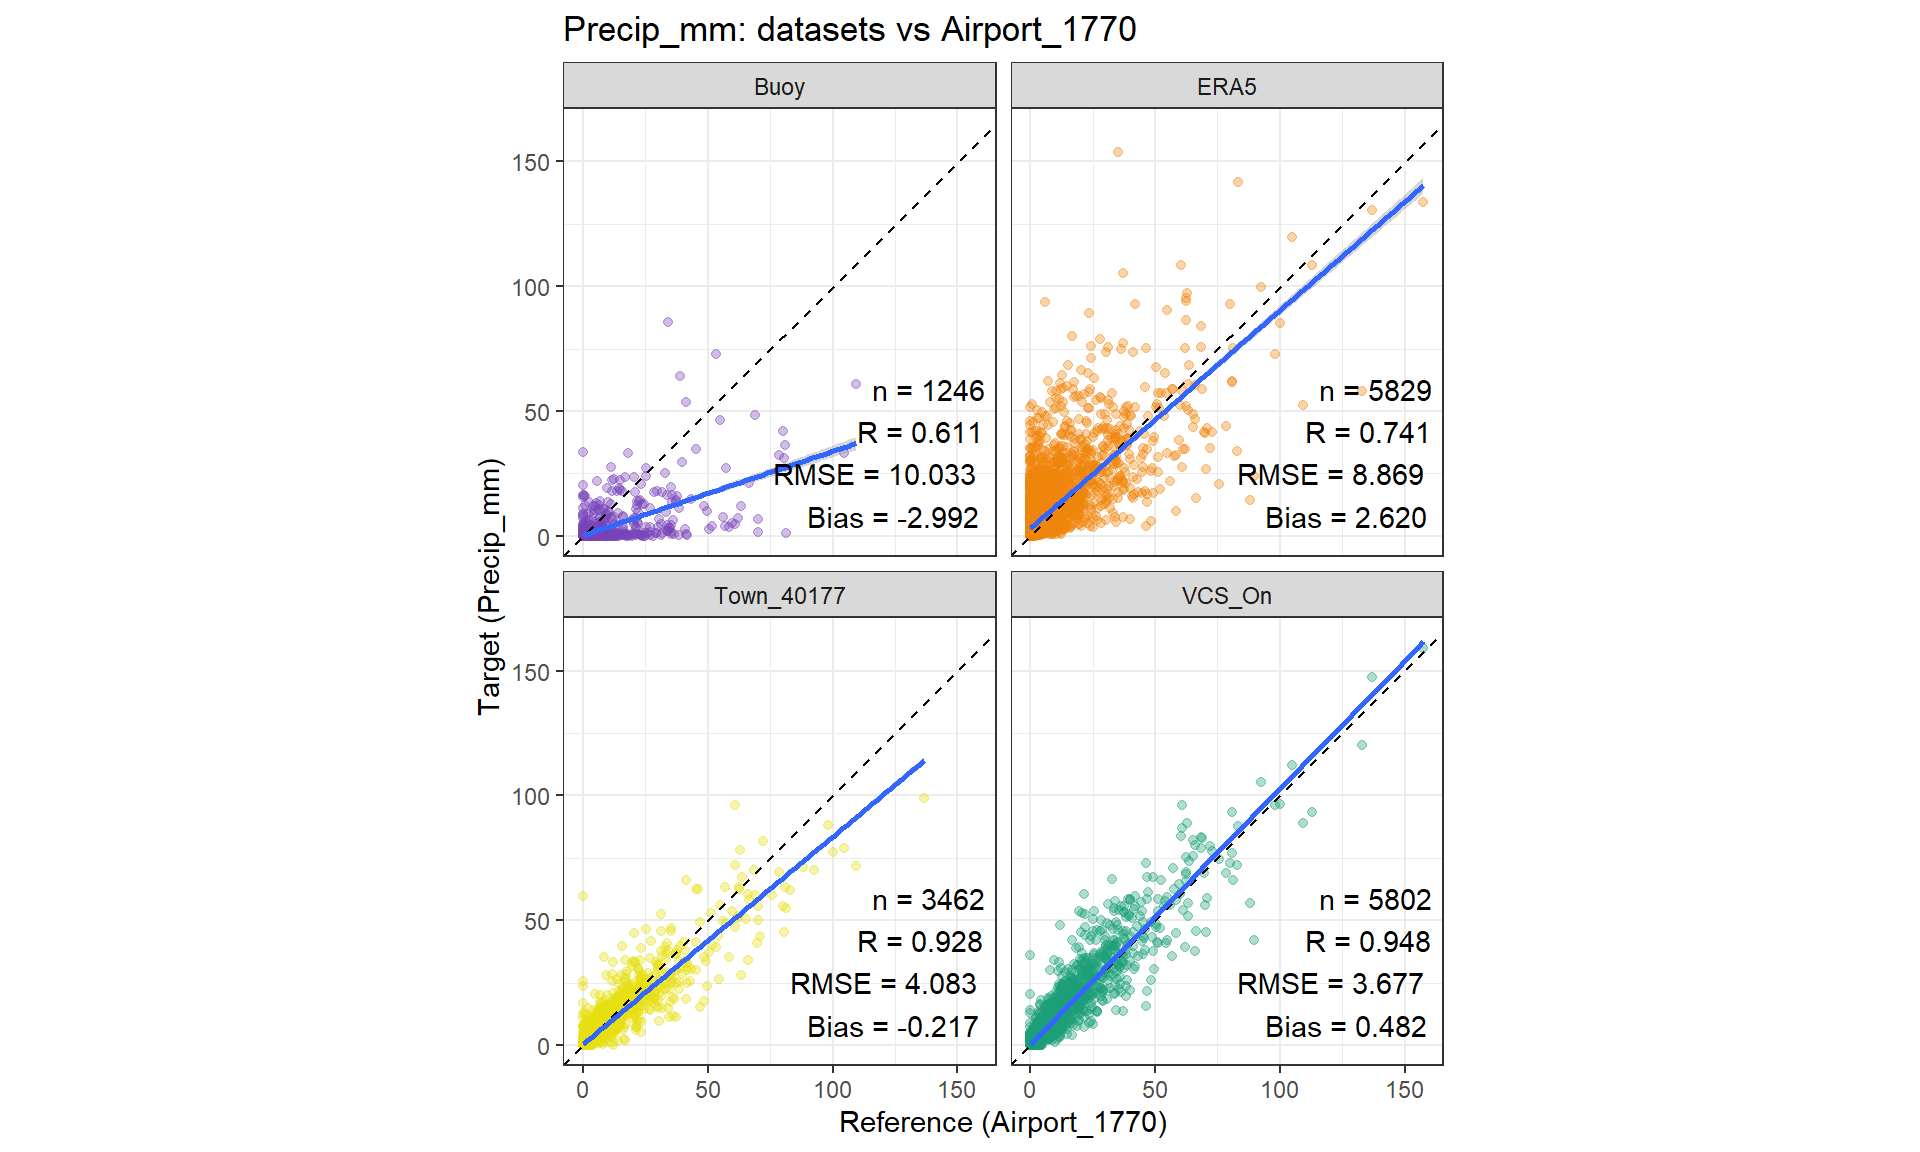
Rainfall agreement is highly variable across datasets. VCS_On and Town_40177 show the strongest linear agreement (high r, low RMSE), with regression lines close to 1:1. ERA5 shows moderate but a positive bias (overestimation). Buoy has the weakest agreement, largest RMSE, and a negative bias, reflecting poorer partnership with the airport precipitation.
Rolling diagnostics (drift through time)
Rolling diagnostics reveal gradual offsets or drift through time where breaks away from 0 bias or a changing correlation is looked for, answering the “does it shift seasonally?” question. Because precipitation is intermittent and heavy tailed, errors are regime-dependent (large during event windows). Consideer the 30-day-rolling plots along side wet-day/event metrics, not all-days metrics alone.
Temperature
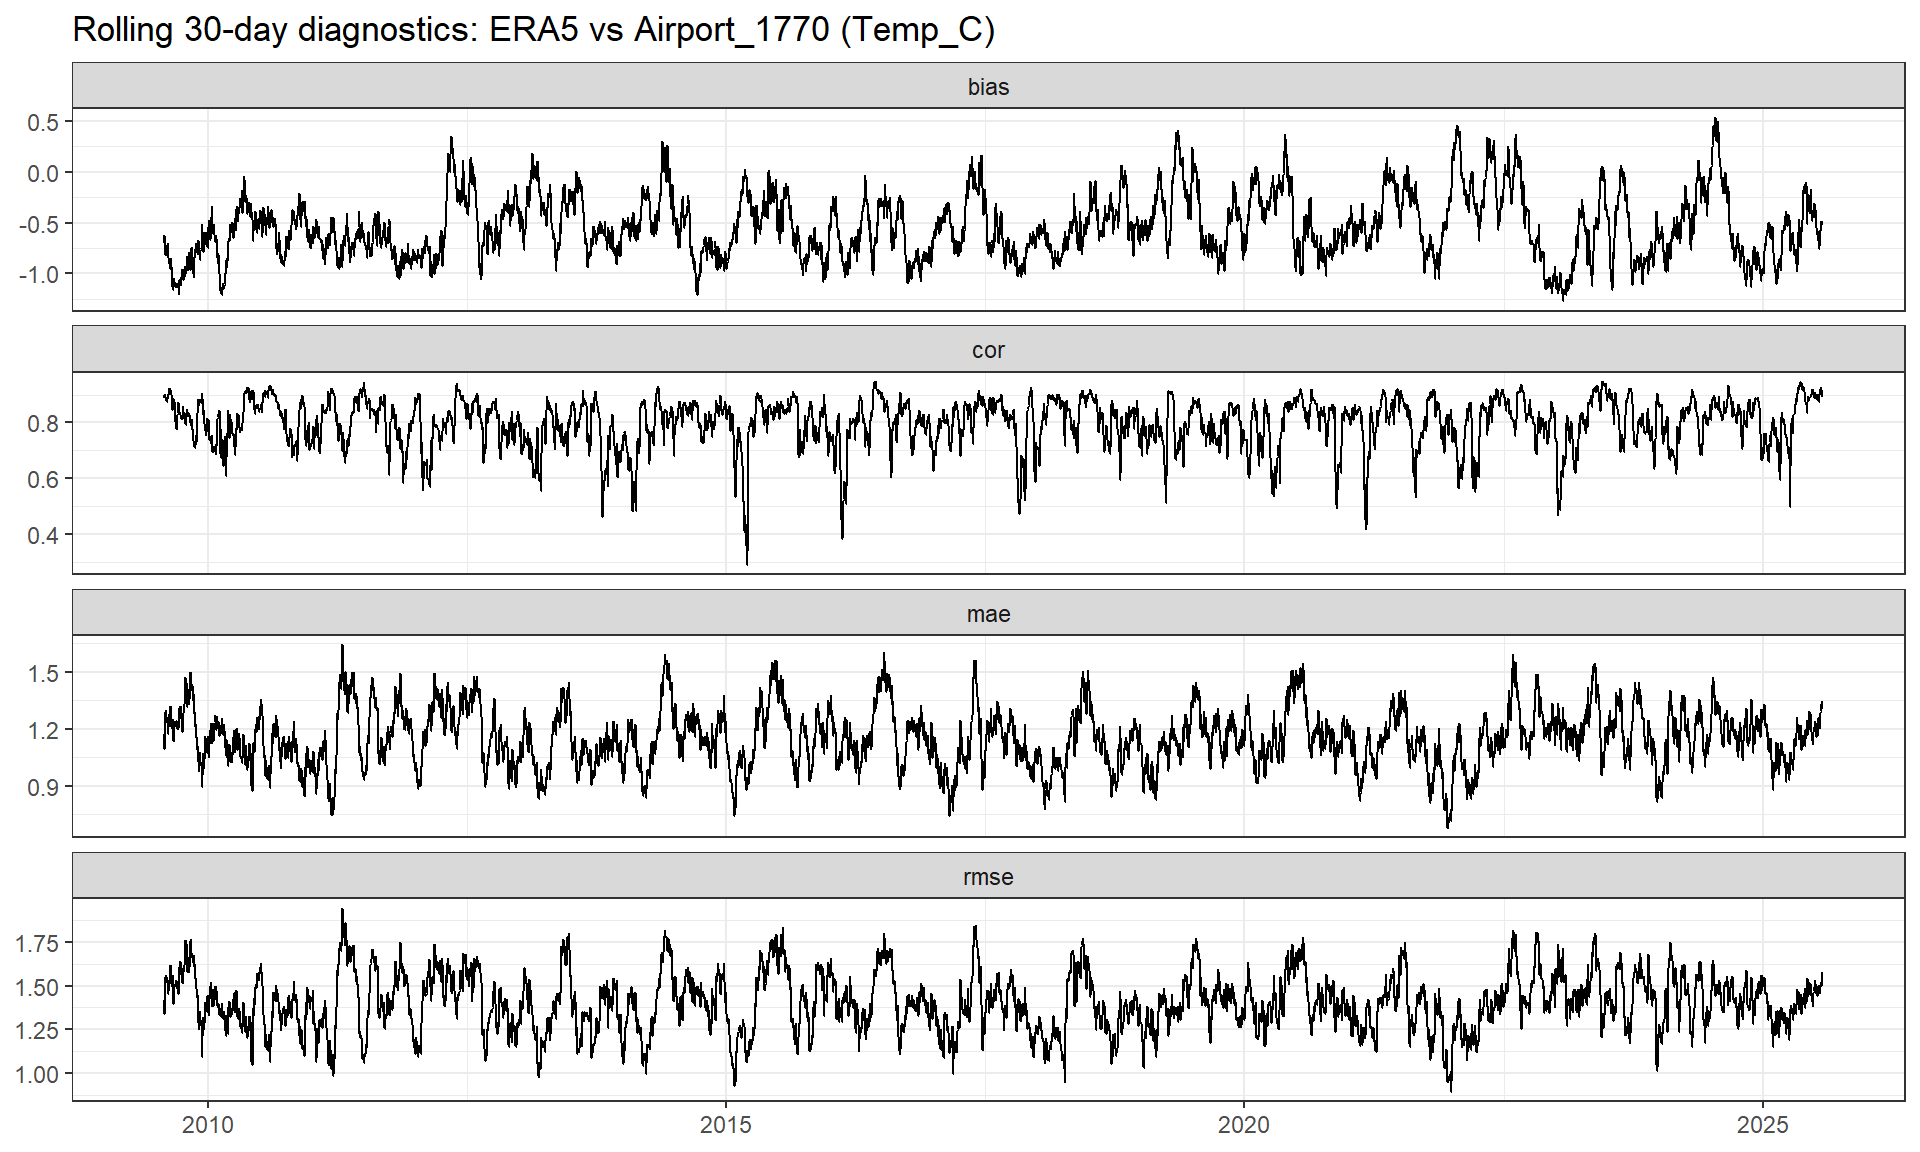
ERA5 temperature
The bias is consistently negative, indicating ERA5 is cooler than the airport on average. Correlation remains moderate to high with intermittent dips, while MAE/RMSE show modest oscillations without extreme spikes, suggesting stable but slightly biased performance. ERA5 temperatures are lower than Airport_1770 across the plot. Correlation is generally strong with short, sharp, low values, indicating good temporal tracking most of the time. Moderate error levels: MAE/RMSE remain relatively steady with small oscillations.
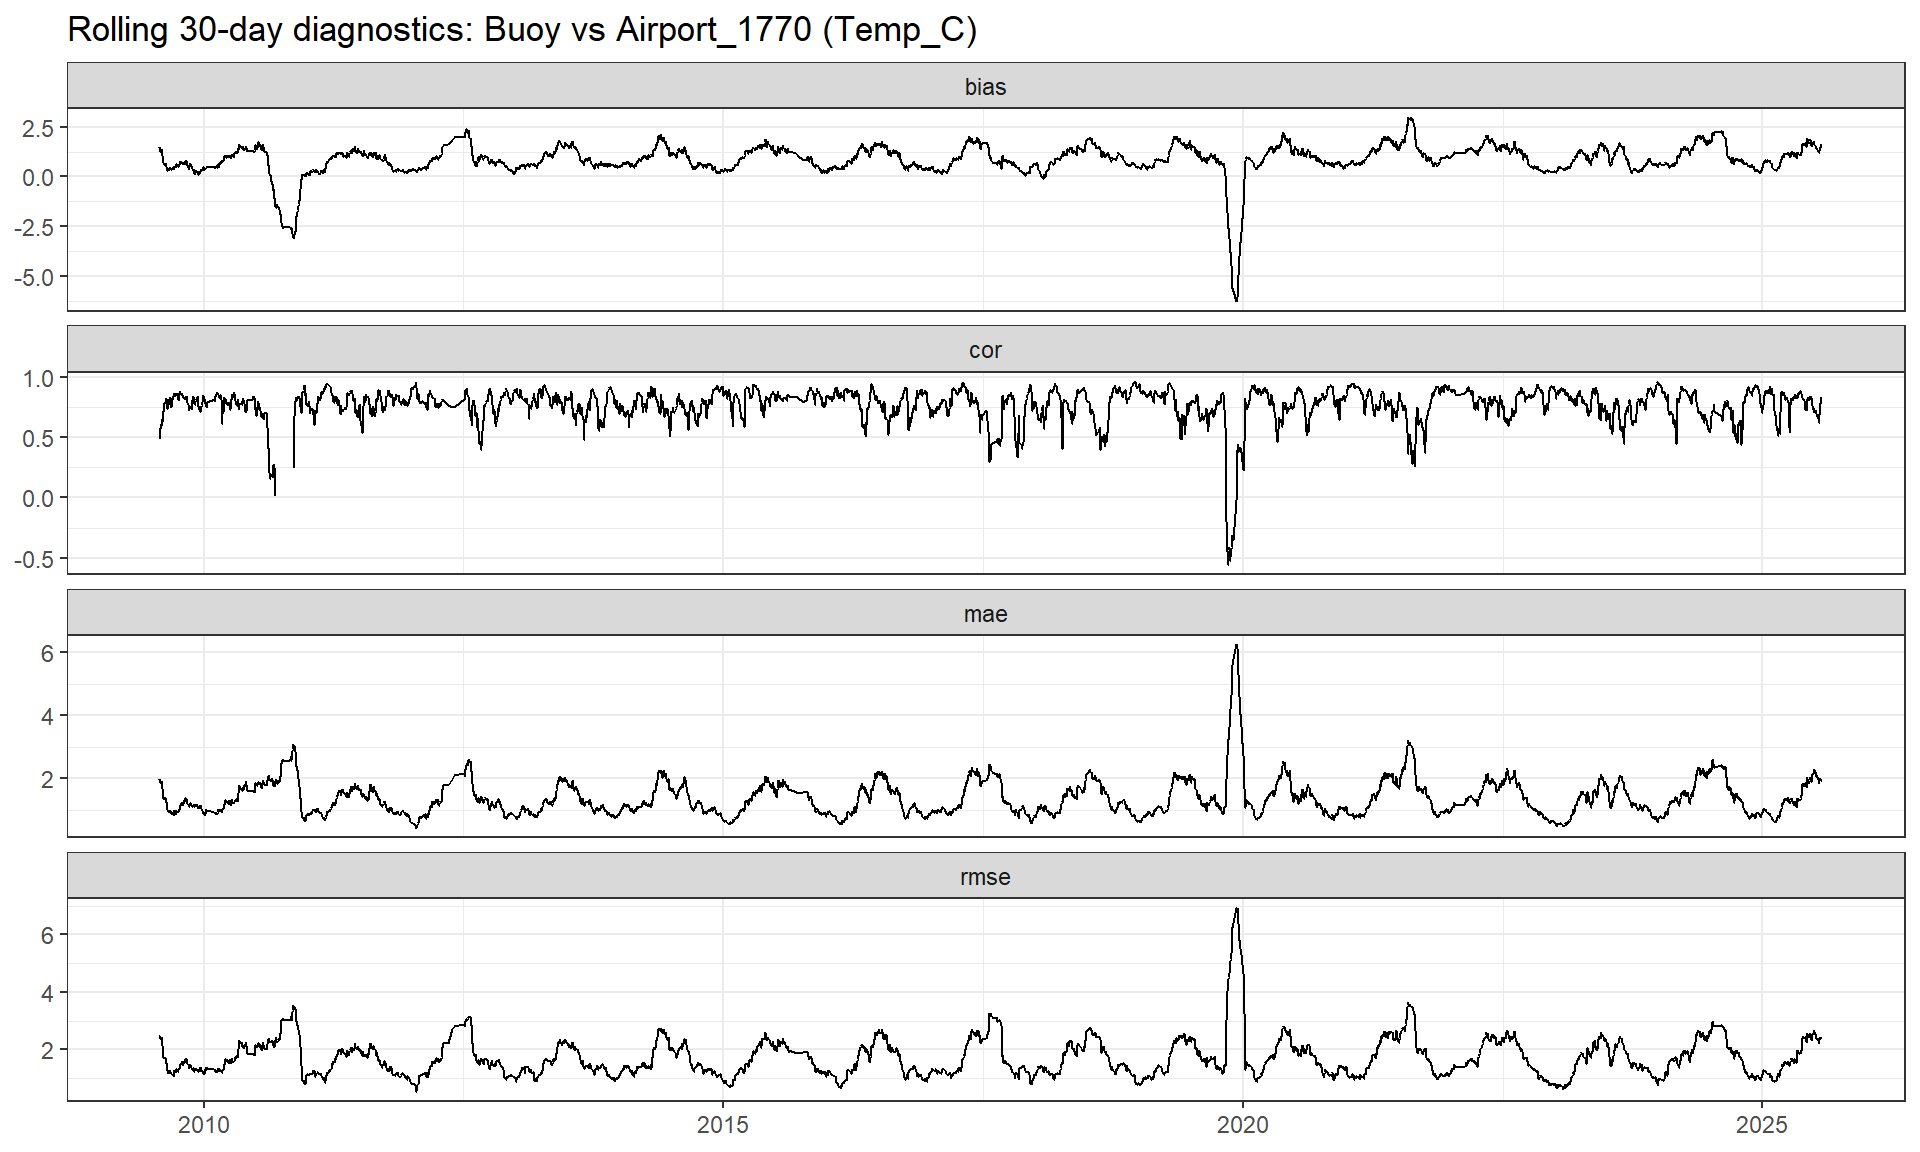
Buoy temperature
Bias is mostly positive, with two standout negative points. In particular, in late 2019, which coincides with sharp drops in correlation and spikes in MAE/RMSE. Outside these events, correlation is high, and errors are low. Buoy temperatures tend to be higher than the reference.
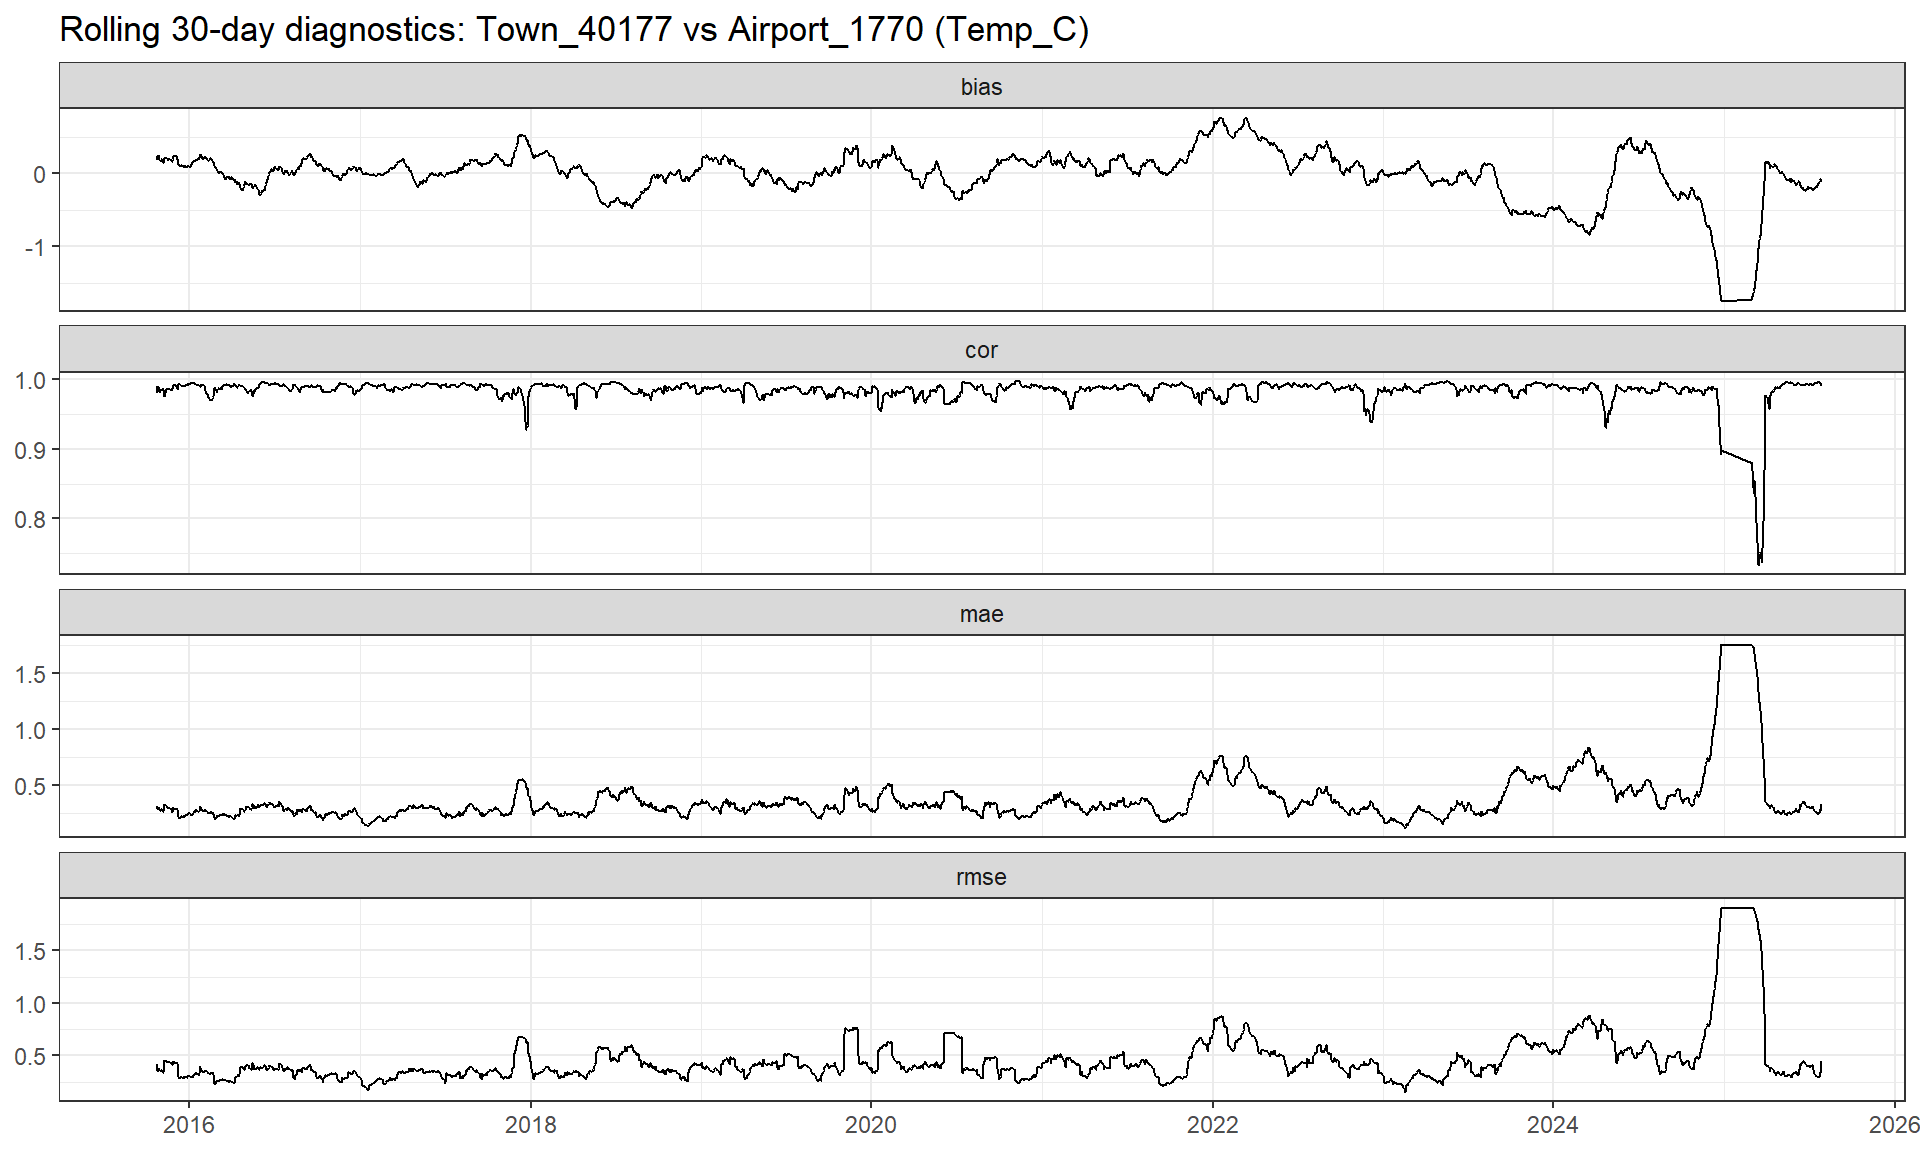
Town temperature
Bias is near zero for much of the record, showing agreement, but in 2025 a defined negative bias, drop in correlation and sharp increases in MAE/RMSE show more measurement errors.
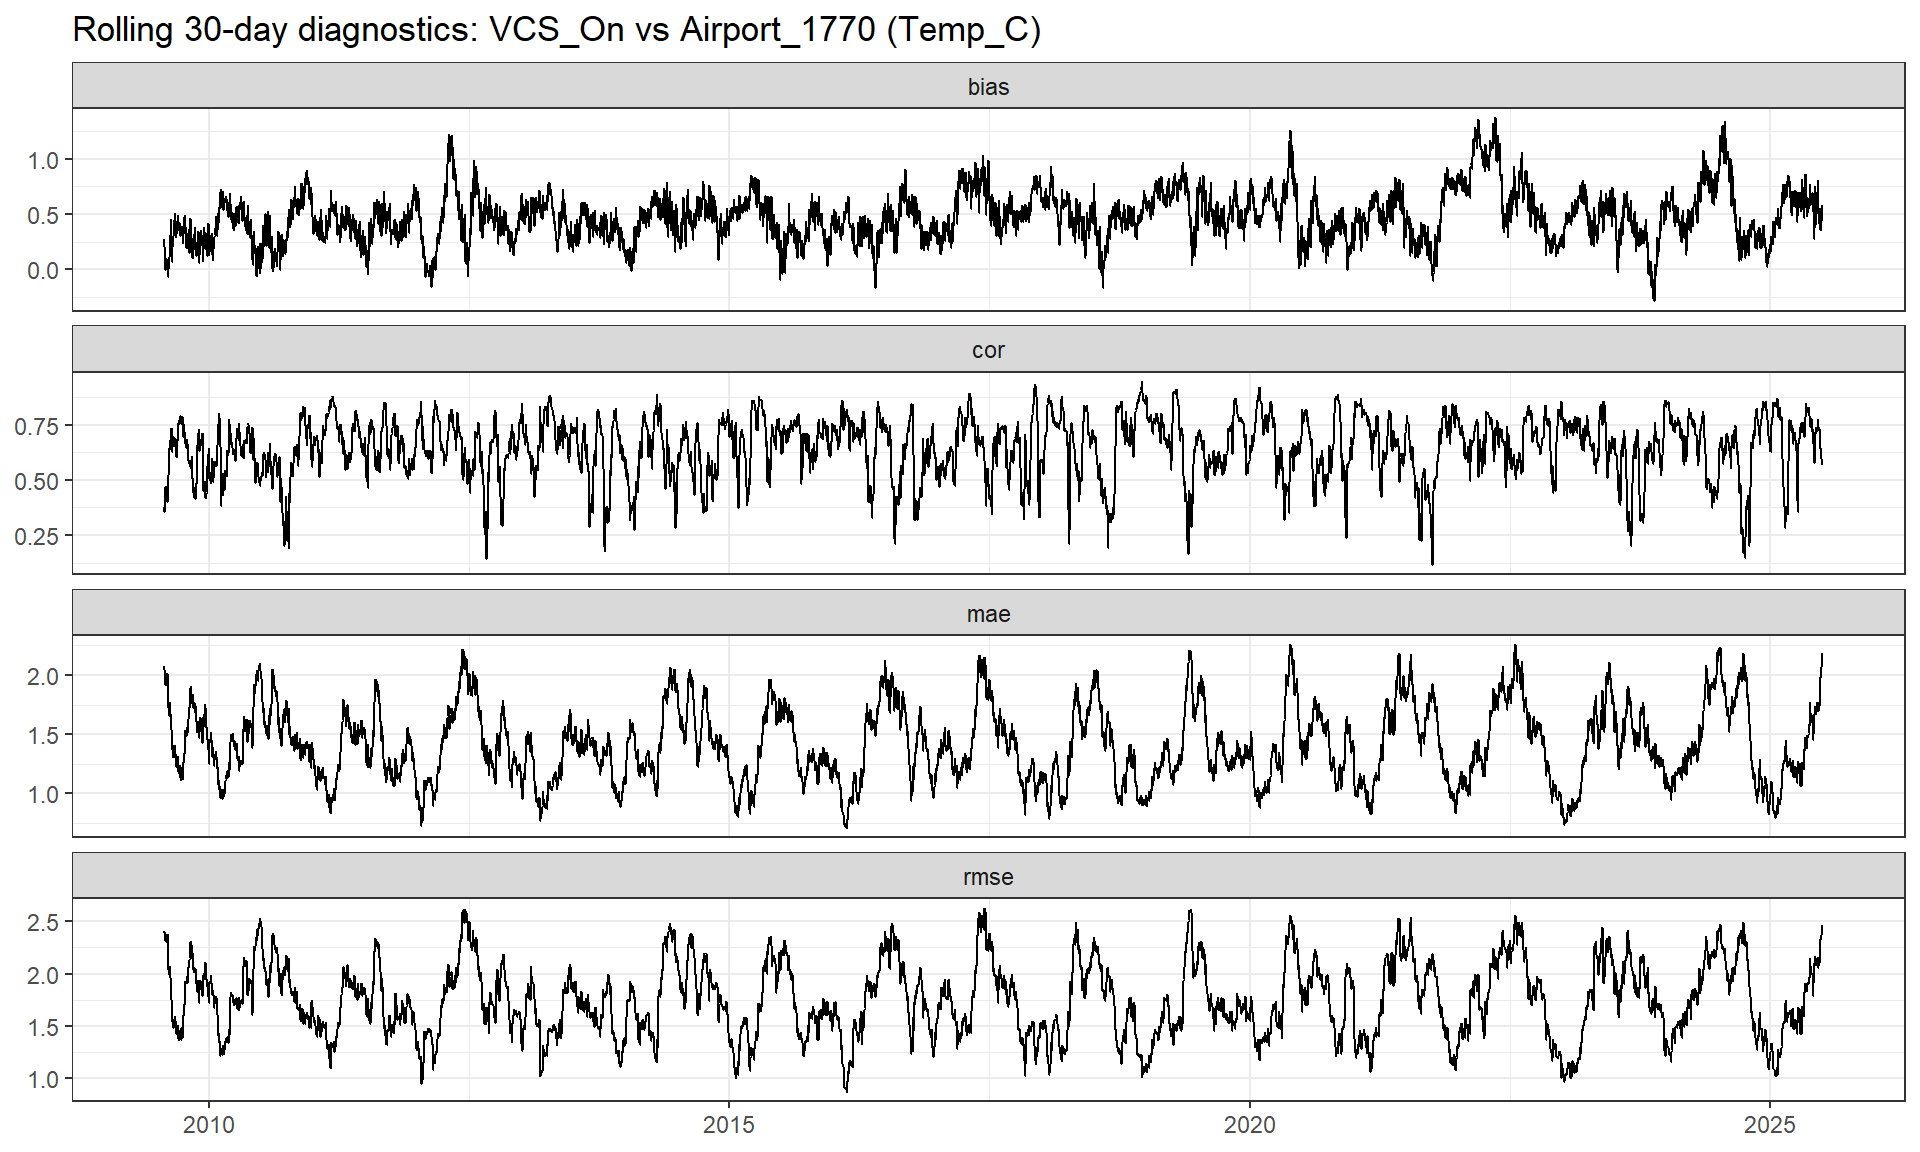
VCSN temperature
Bias is consistently positive, indicating VCS_On is warmer on average. Correlation is moderate and variable with frequent dips, while MAE/RMSE shows more consistent oscillations without extreme spikes.
Wind
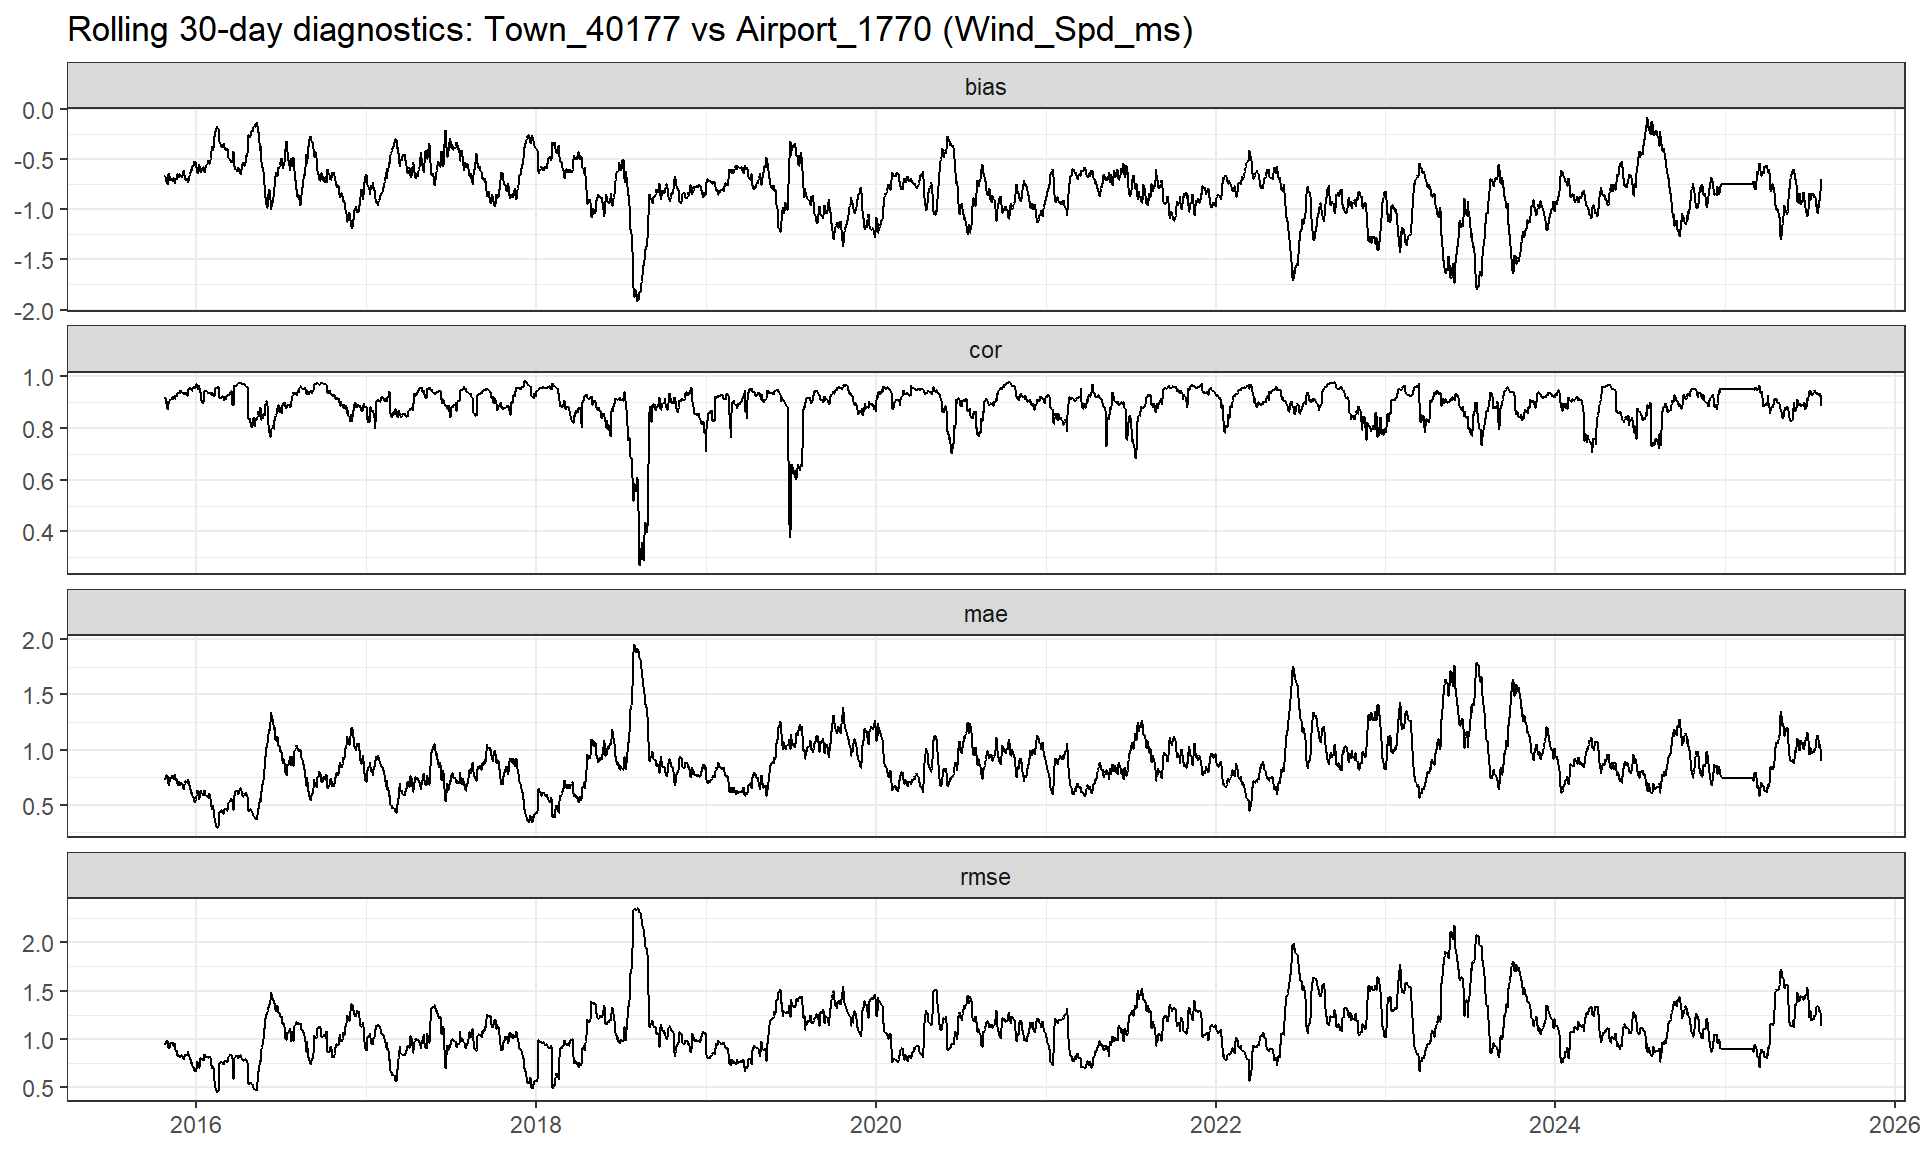
Town wind
Bias is mostly negative, showing overall low bias in Town_40177 relative to Airport_1770. Correlation is high for most of the record but shows intermittent drops, along with short periods of increased MAE/RMSE. Error magnitudes are somewhat low, but show periods of spikes, indicating periods of reduced agreement that are short lived rather than more permanant. Correlation is typically high (near the upper range of the axis). Some short, sharp drops in correlation and peaks in MAE and RMSE in mid 2018.
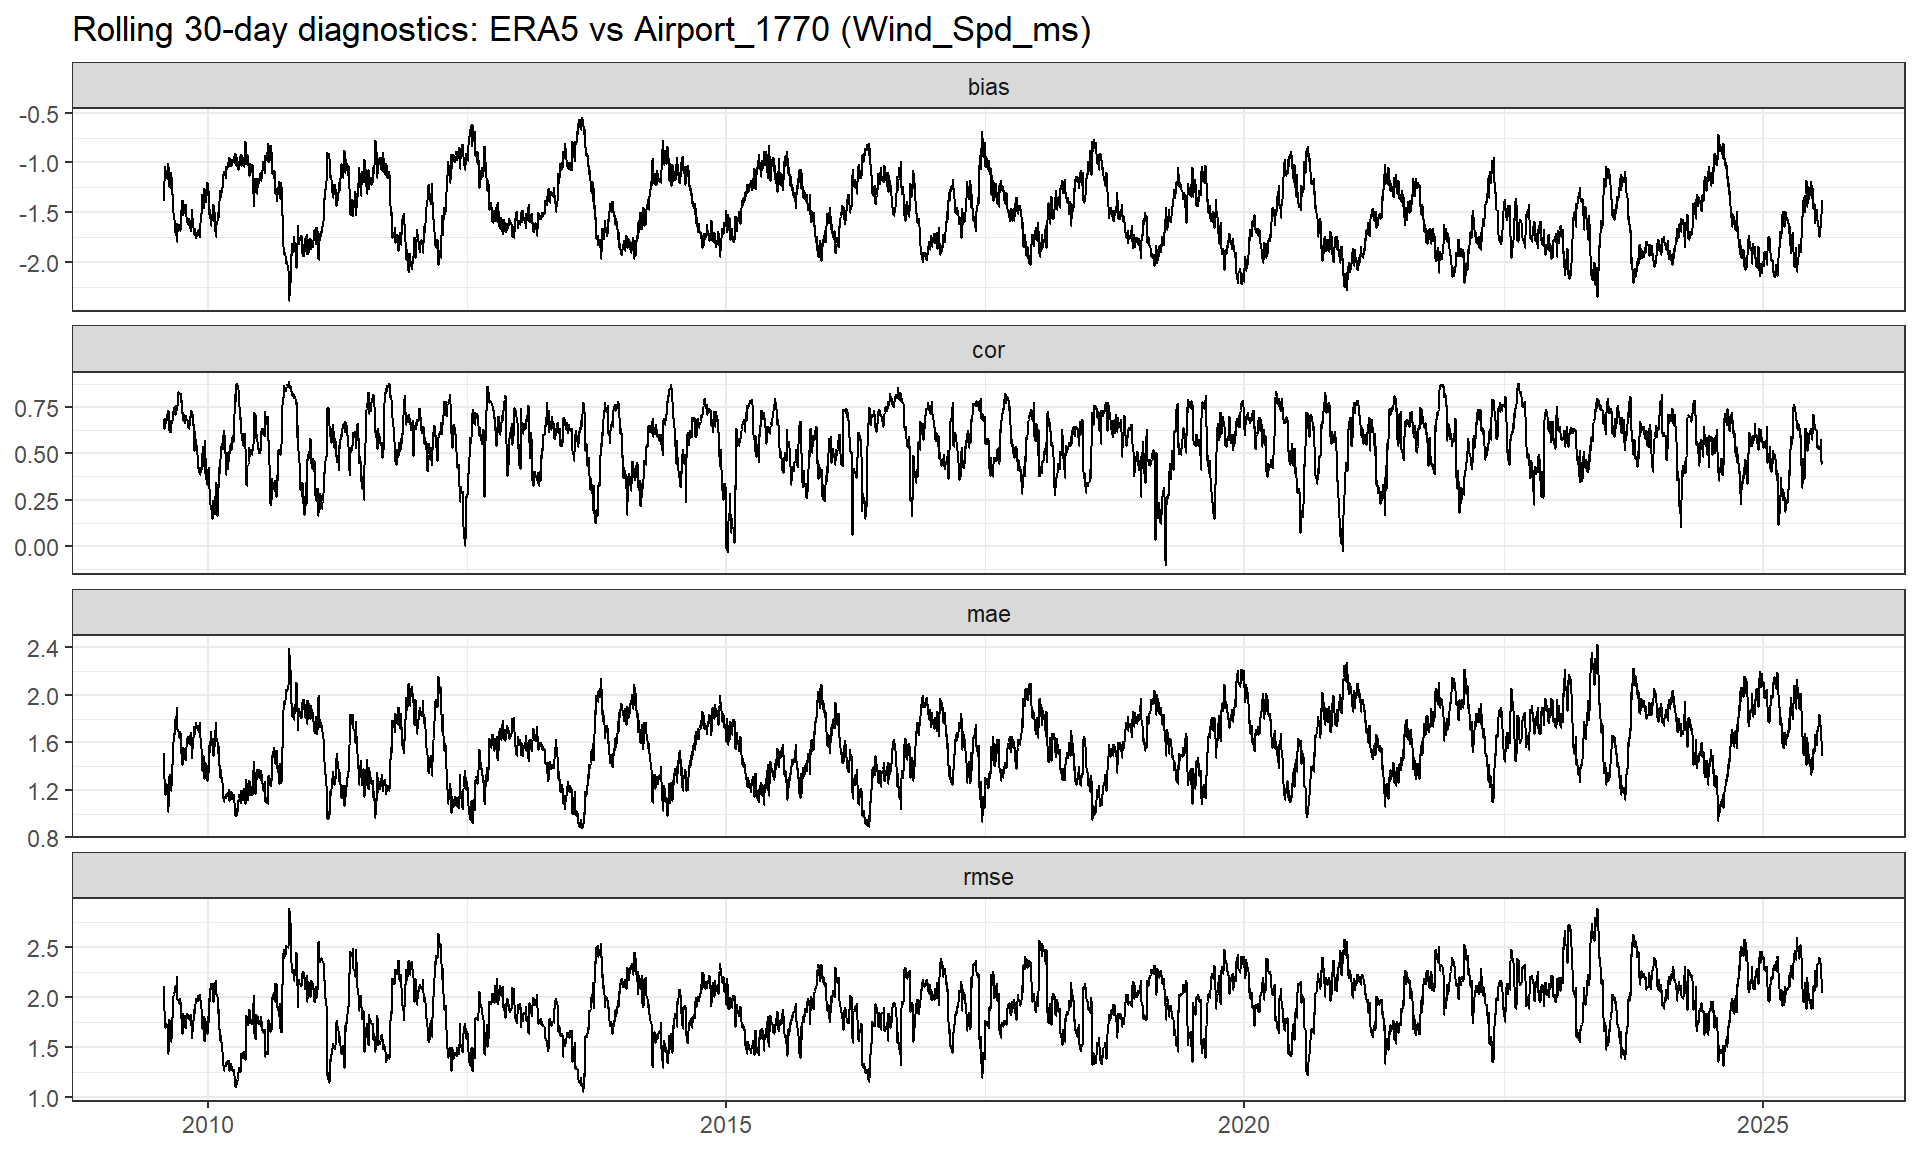
ERA5 wind
For the ERA5 source the bias is consistently negative across the timeline, showing underestimation of wind speed by ERA5. Correlation fluctuates around moderate values with frequent short‑lived drops, while MAE and RMSE show pronounced seasonal oscillations with episodes of peaks. Persistent low bias: ERA5 wind speeds are consistently below the airport reference (negative bias throughout). Lower day to day agreement and more volatile than some other station to station comparison, with frequent dips in correlation. MAE/RMSE show clear oscillations and repeated peaks. Several short sharp drops in correlation and elevated errors.
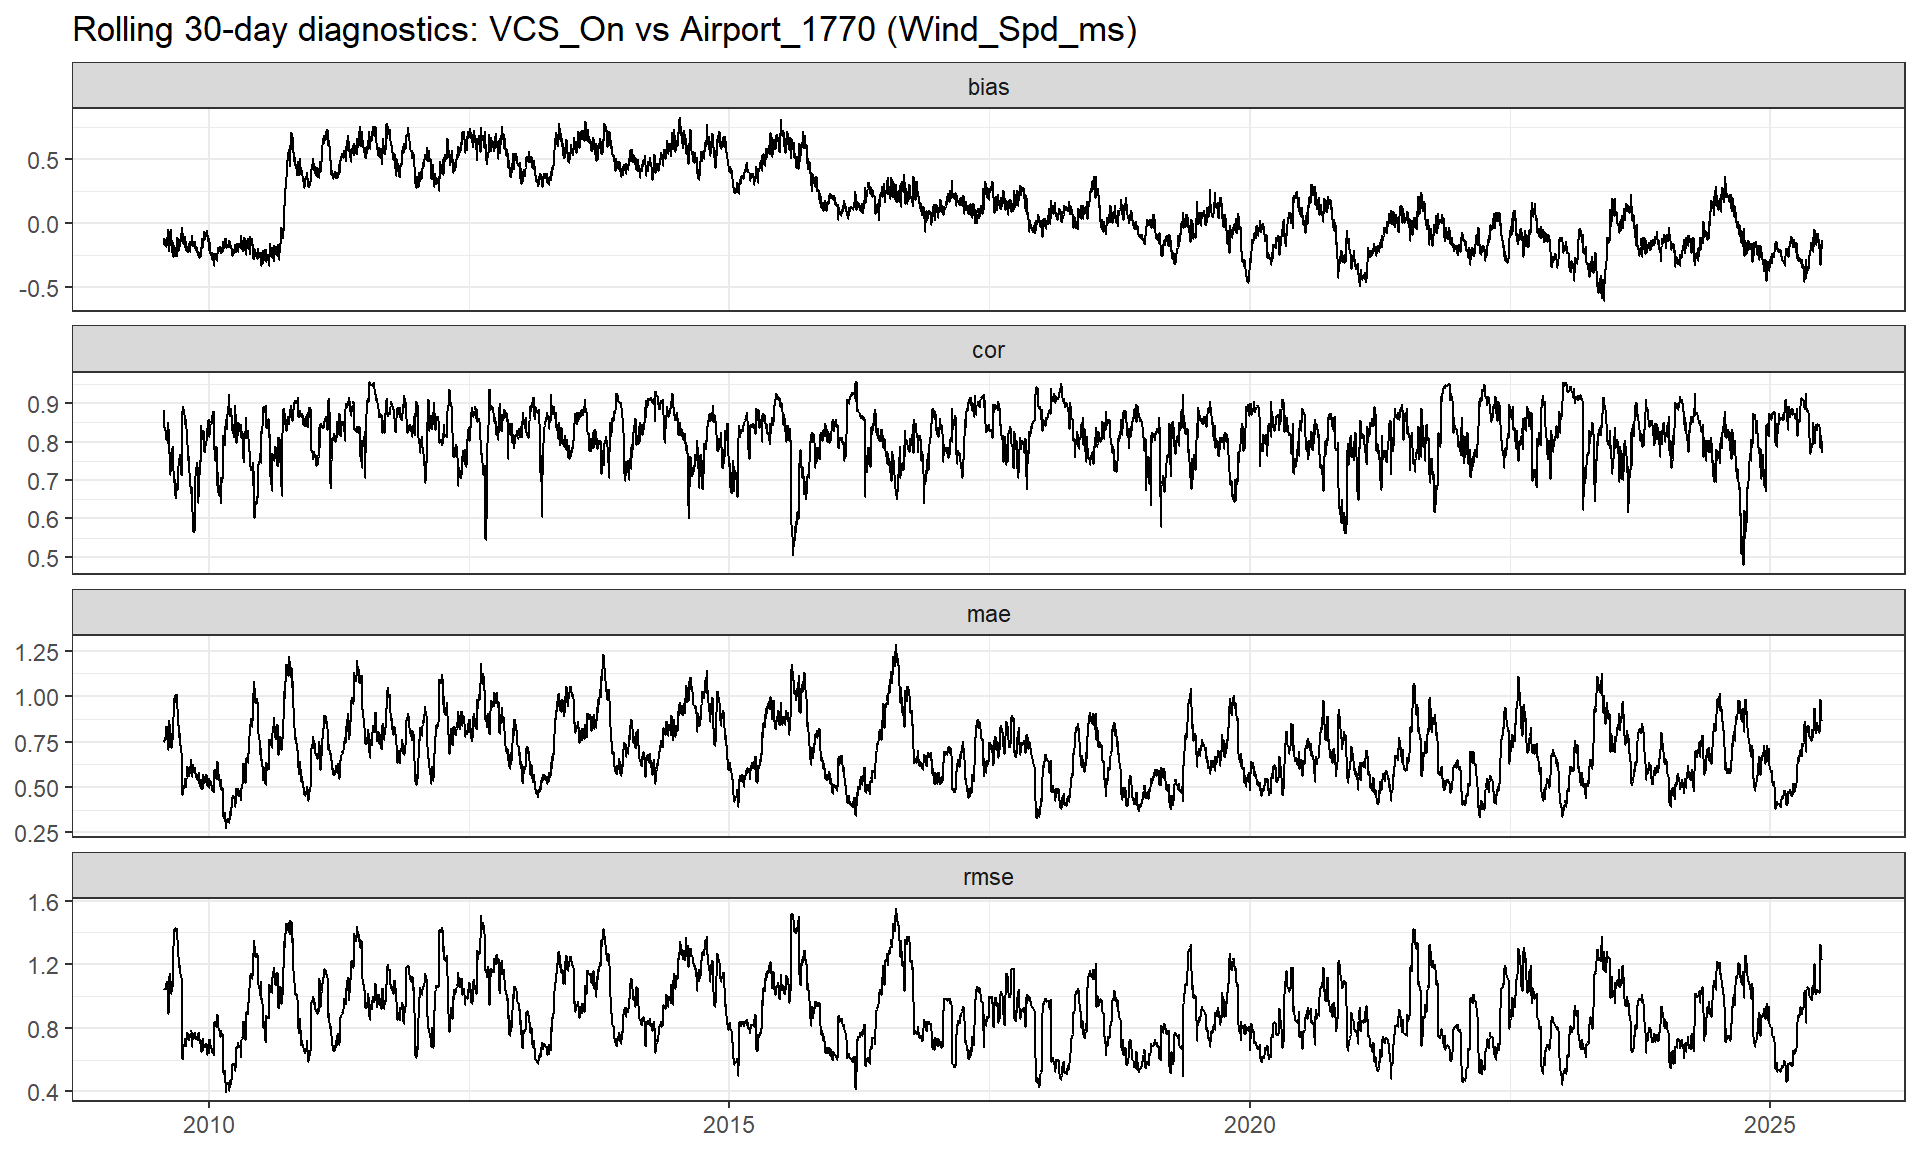
VCSN wind
Bias shifts over time from slightly positive in the early record toward near‑zero and then slightly negative values, indicating a gradual drift in mean offset. Correlation remains moderate to high with intermittent dips, while MAE/RMSE display recurring oscillations without large spikes.
Slow bias drift are seen. Mean bias trends from positive to slightly negative across the record, showing gradual change in relative wind magnitude. Correlation is generally moderate–high with periodic drops, reflecting time‑varying agreement. MAE/RMSE show cyclical variability but no extreme excursions, suggesting steady performance without major anomalies. VCS_On captures wind variability reasonably well, but bias may need adjustment.
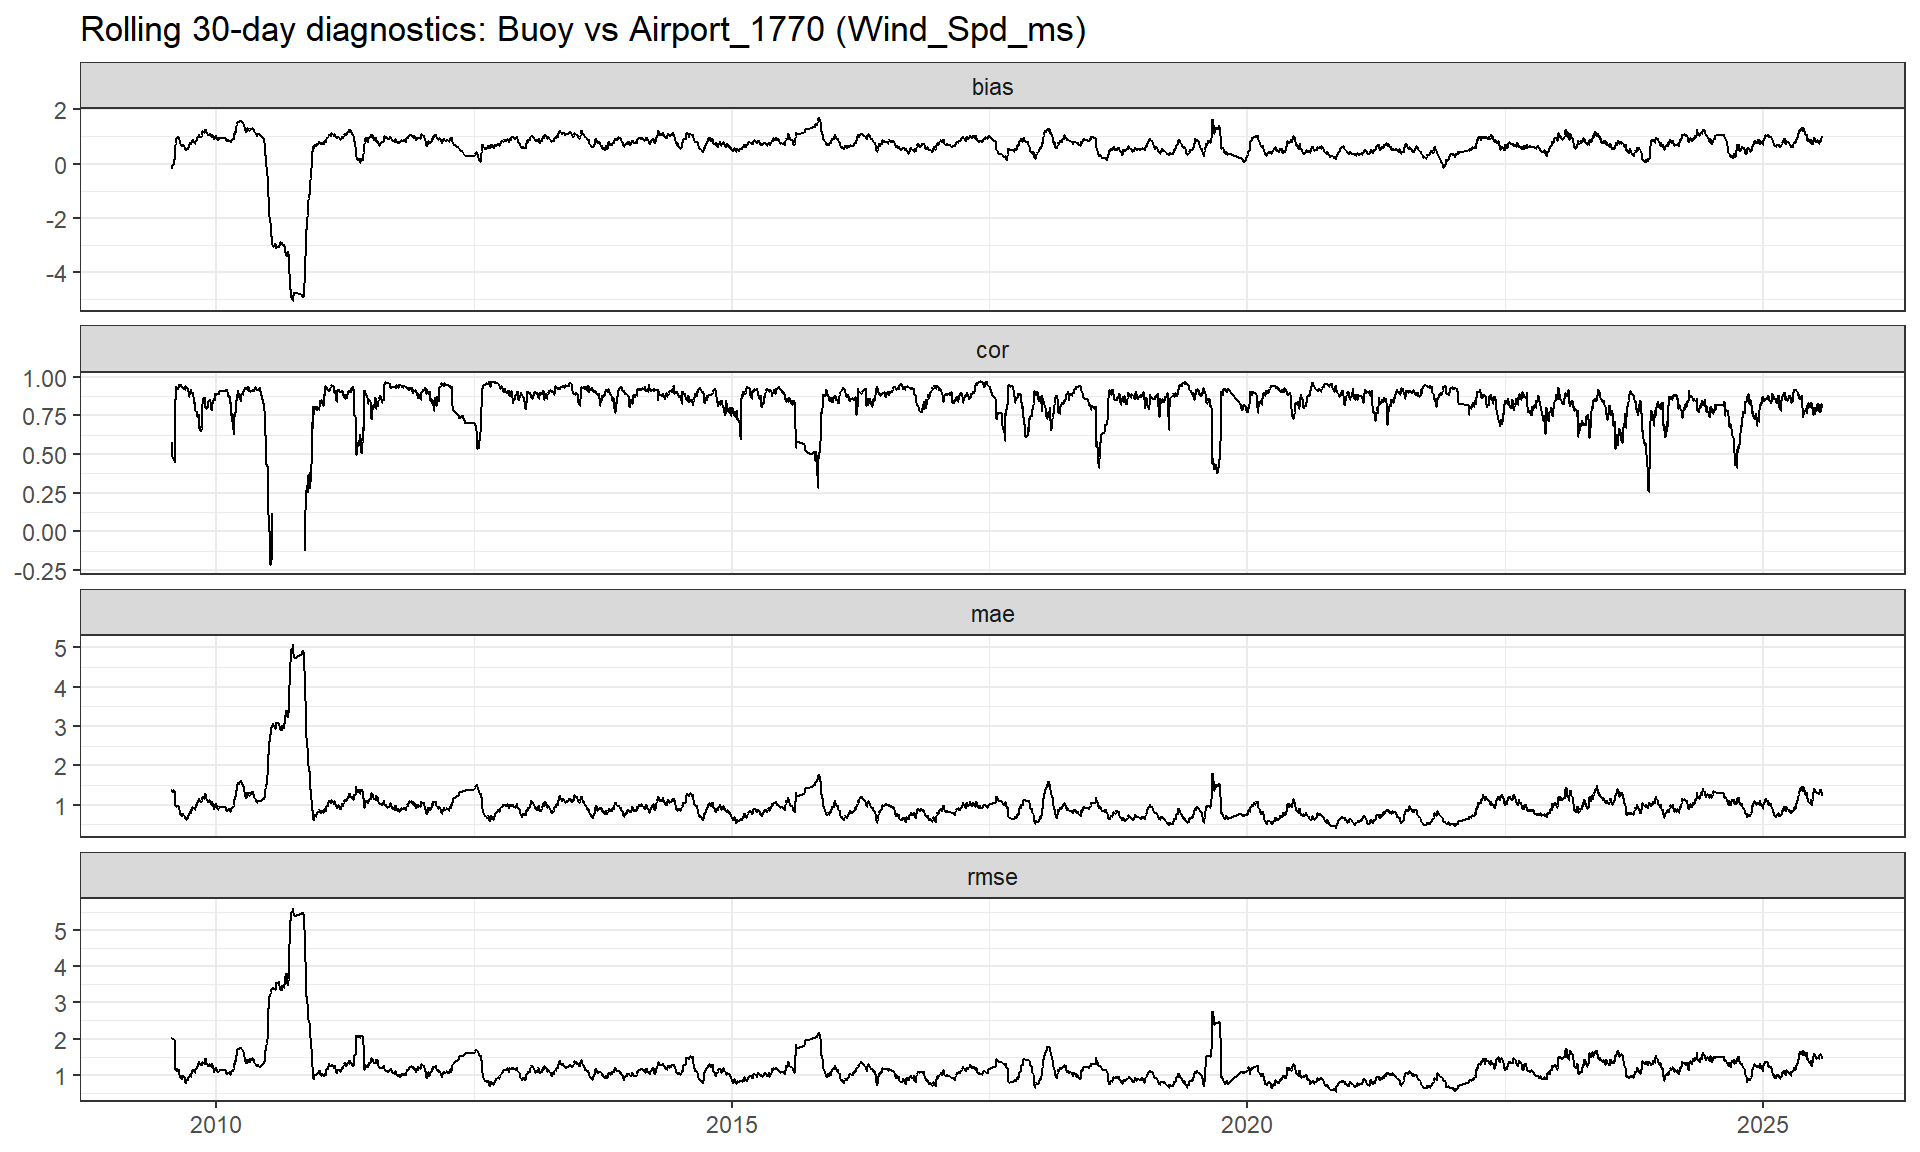
Buoy wind
A pronounced early anomaly is evident as a sharp negative bias, collapse in correlation, and a simultaneous spike in MAE/RMSE. Outside this episode, bias remains small and positive, correlation is generally high, and errors are comparatively low with occasional minor excursions.
Early anomaly dominates with a short early interval shows extreme disagreement (large negative bias, correlation collapse, large MAE/RMSE), indicating a likely data issue or calibration mismatch in that period. Otherwise strong agreement. After the anomaly, correlation stays high and error levels are low, implying good temporal coherence between buoy and airport winds. The buoy shows a slight positive bias relative to the airport in the stable period. Later deviations are modest and short‑lived, suggesting the relationship is stable after initial issues.
Precipitation
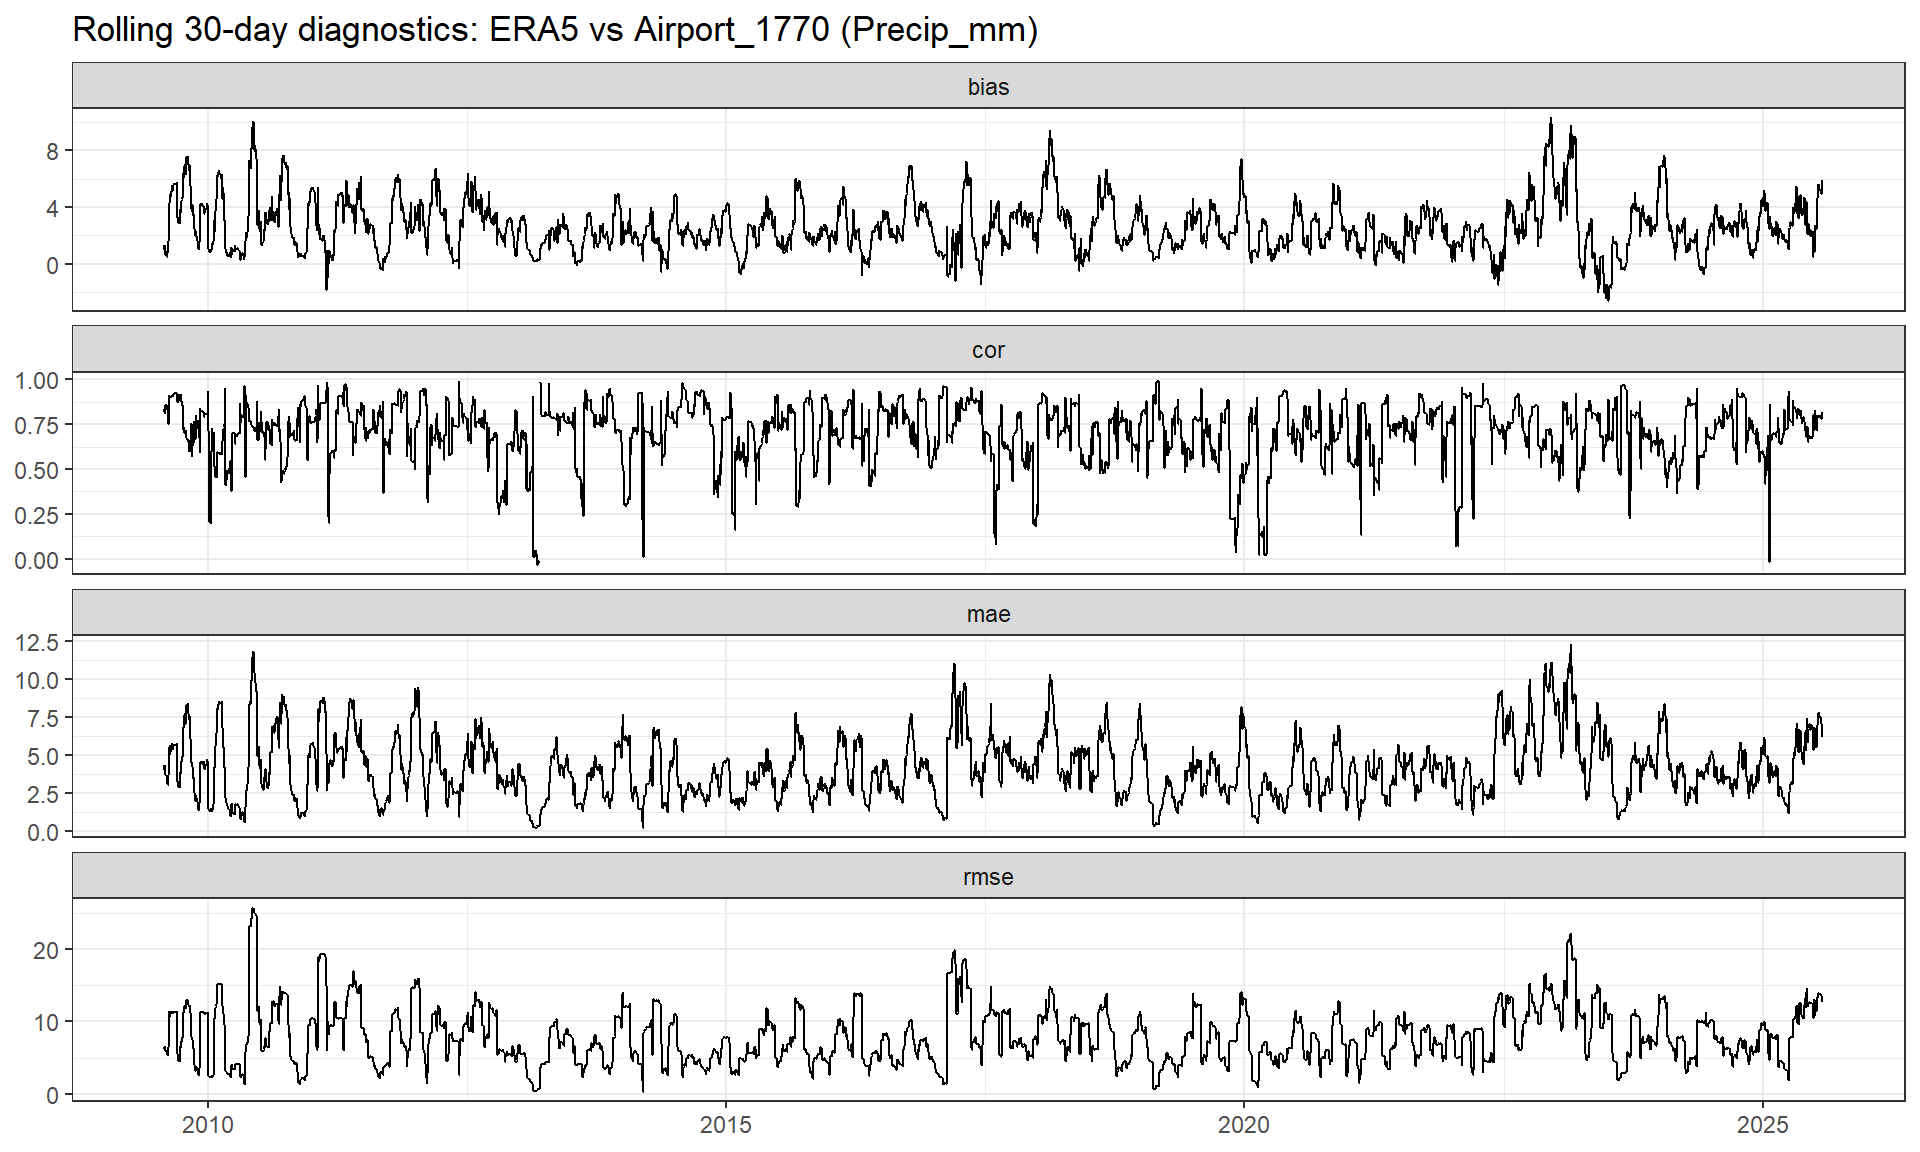
ERA5
ERA5 show a wet bias dominated with moderate correlation overall with periodic short lived drops. MAE/RMSE are largely variable showing temporal cohesion is present but not magnatude compared to the reference dataset, especially in high rain events.
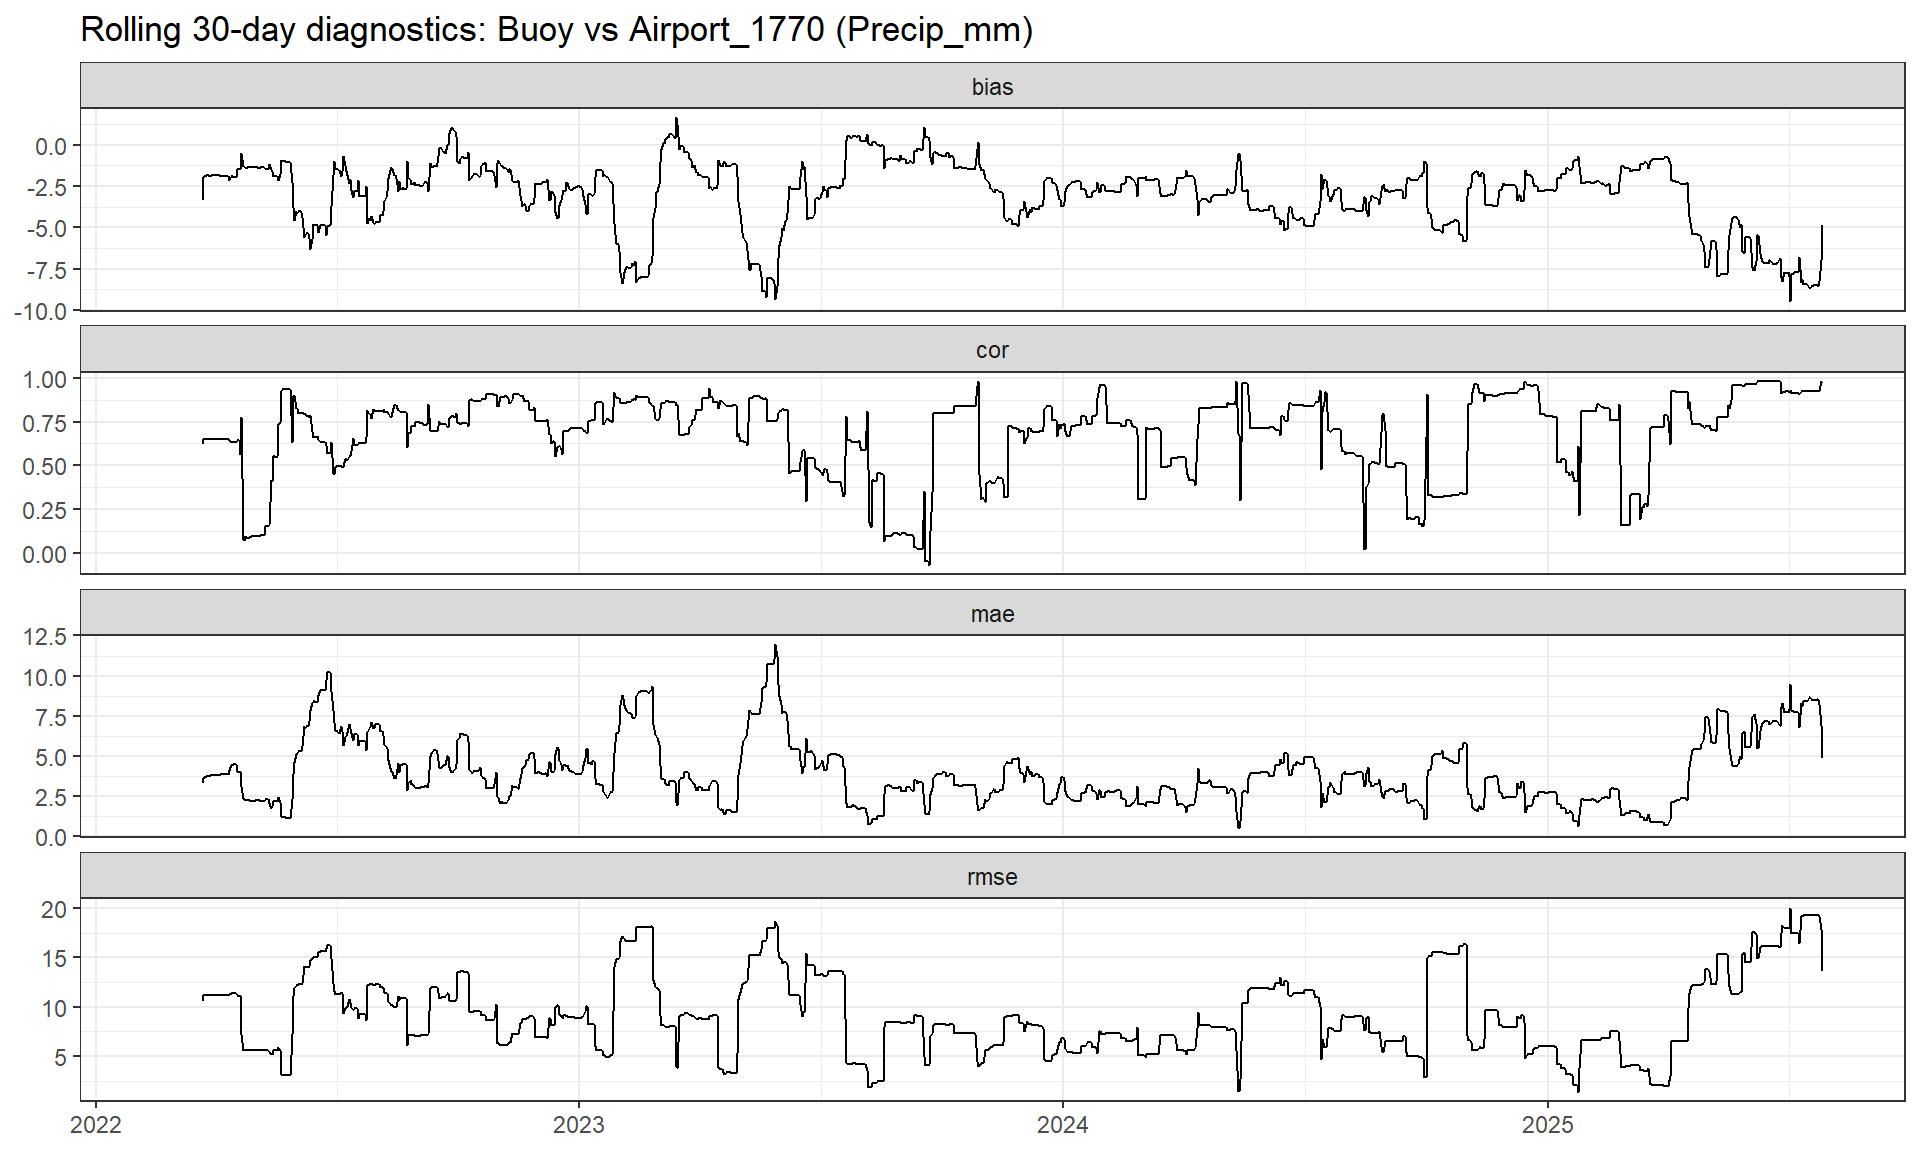
Buoy
The most unstable rainfall dataset is buoy rainfall. Buoy precipitation shows a consistand underestimation. Clear instability is shows with teh shape of the data. MAE/RMSE are elevated and show a staircase increase late in the data.
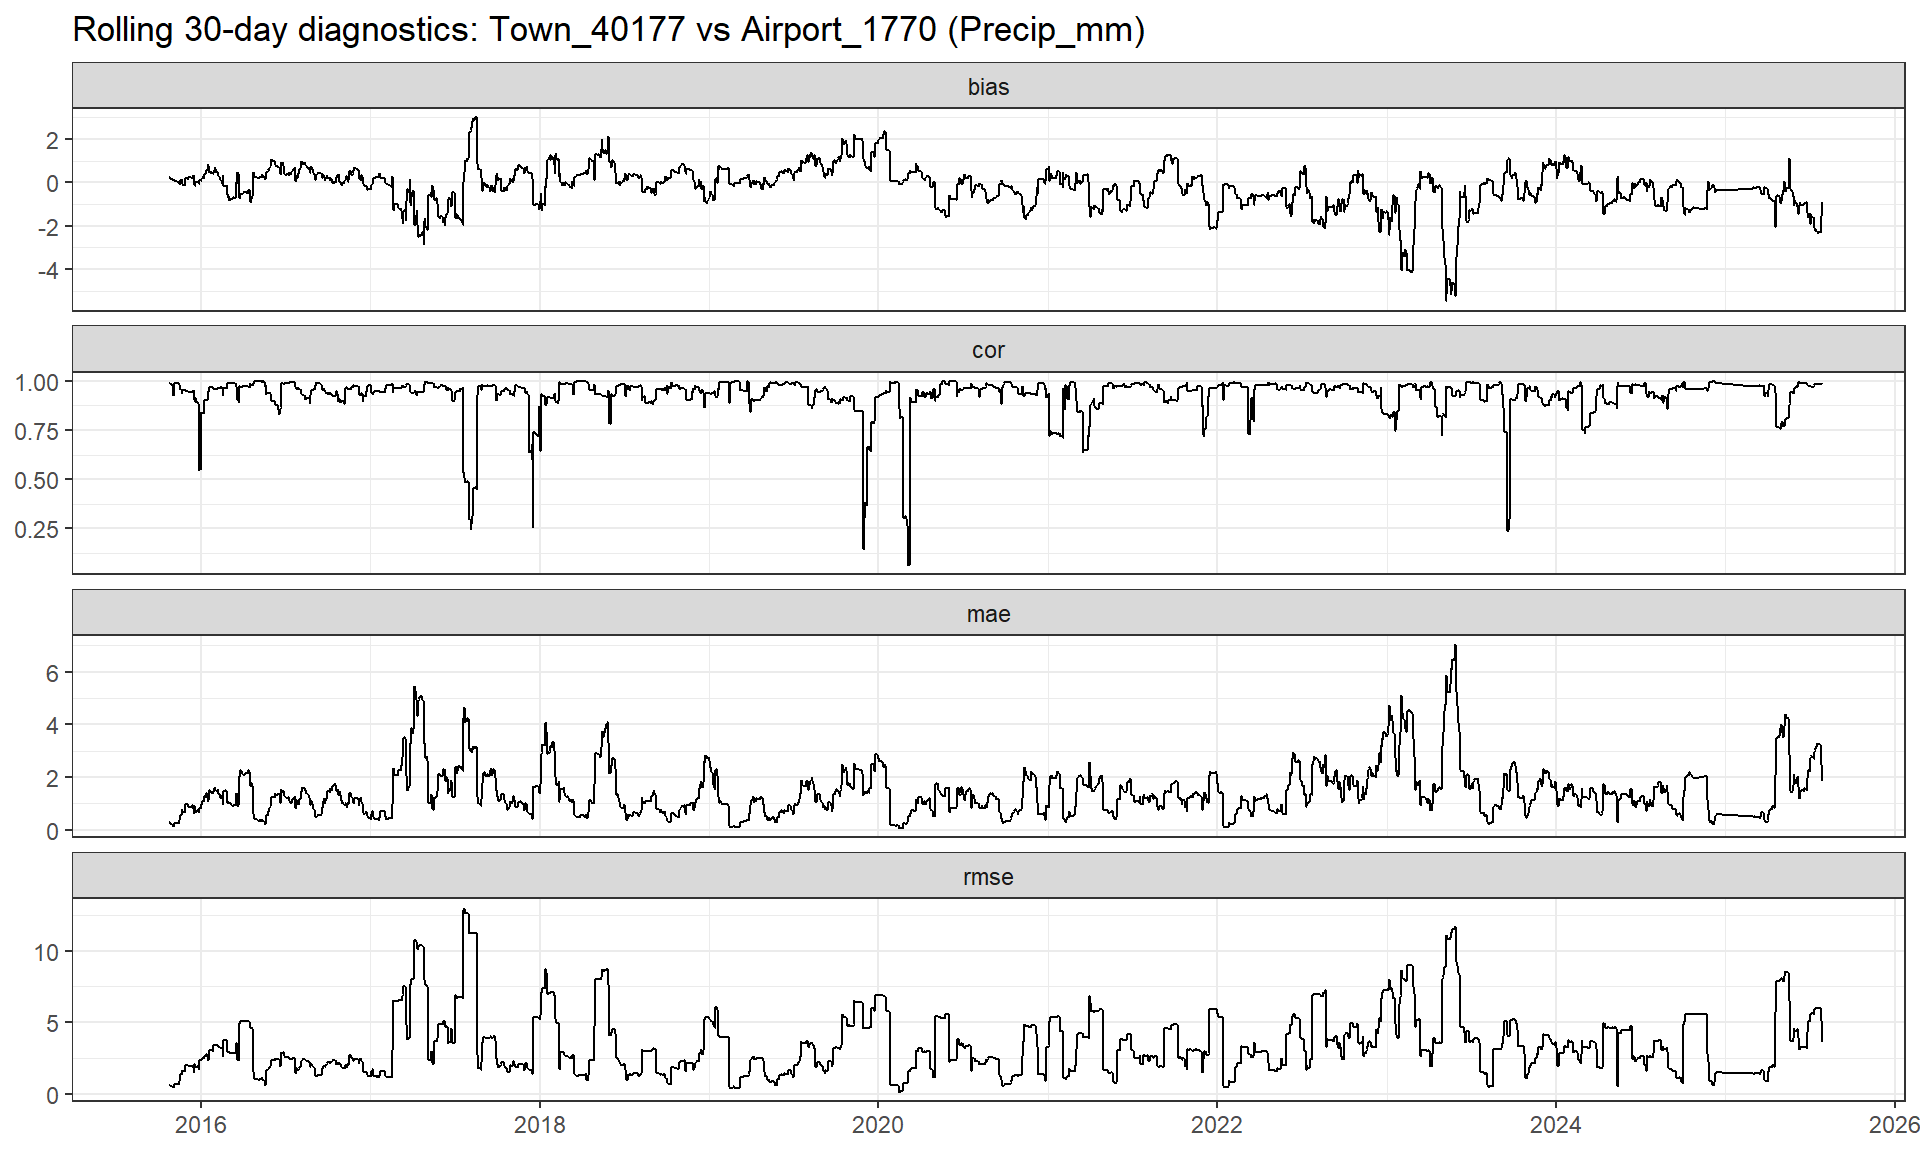
Town
Town precipitation shows overall high correlation with notable plunges. Bias is relativly neutral with a dry bias (2017 and 2023) followed by a 2017 spike (small wet bias) which matched the incresed MAE and RMSE in 2017 and 2023 (deterioration episodes). MAE/RMSE is relativly low with some short periods of small rises.
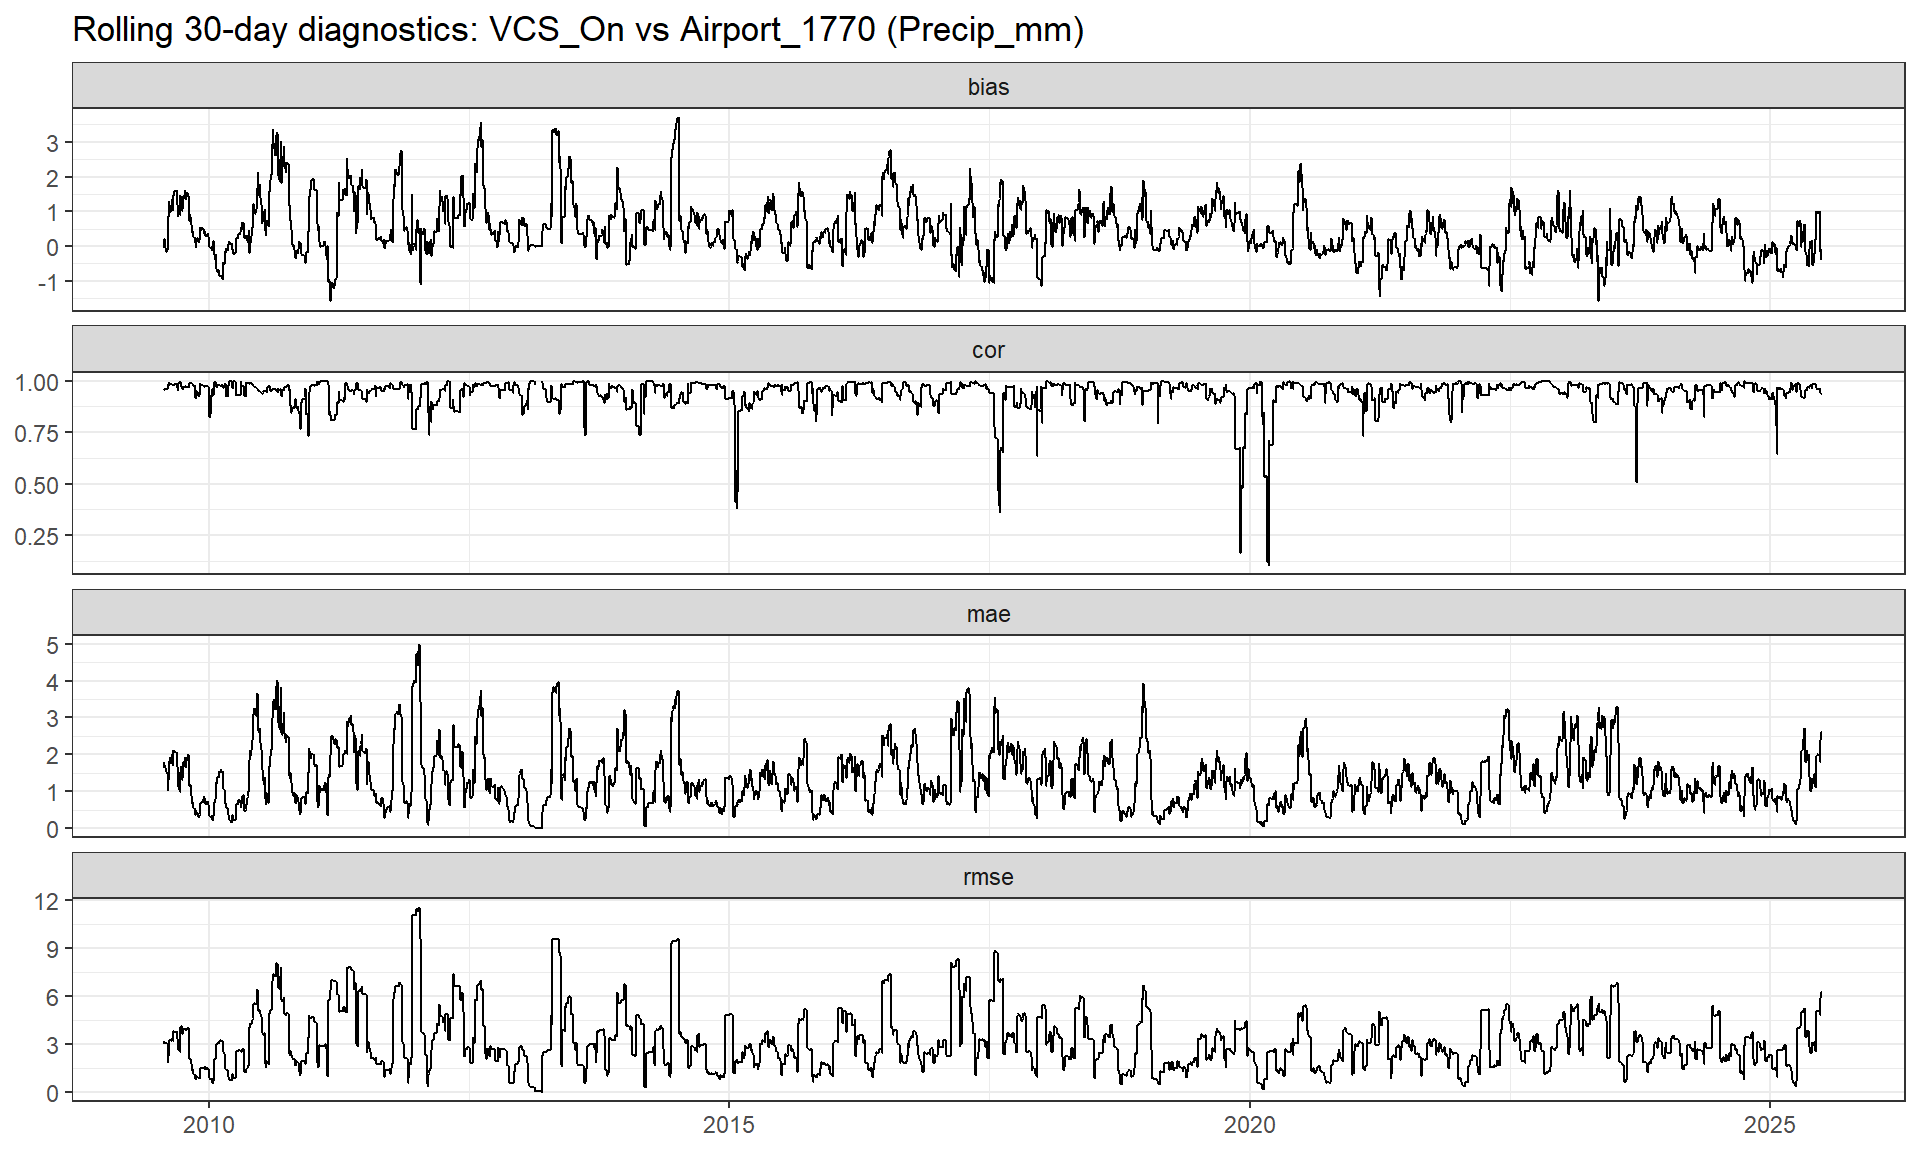
VCS
A Shift from wet (early data) to dry (late data) bias is seen across the daataset. Correlation is high for the most part with occasional drops. MAE/RMSE are relatively stable and moderate relative to ERA5 and BUoy, showing alignment with the reference.