Time-series
This tab focuses on time-series comparisons so you can visually check alignment and stability across datasets.
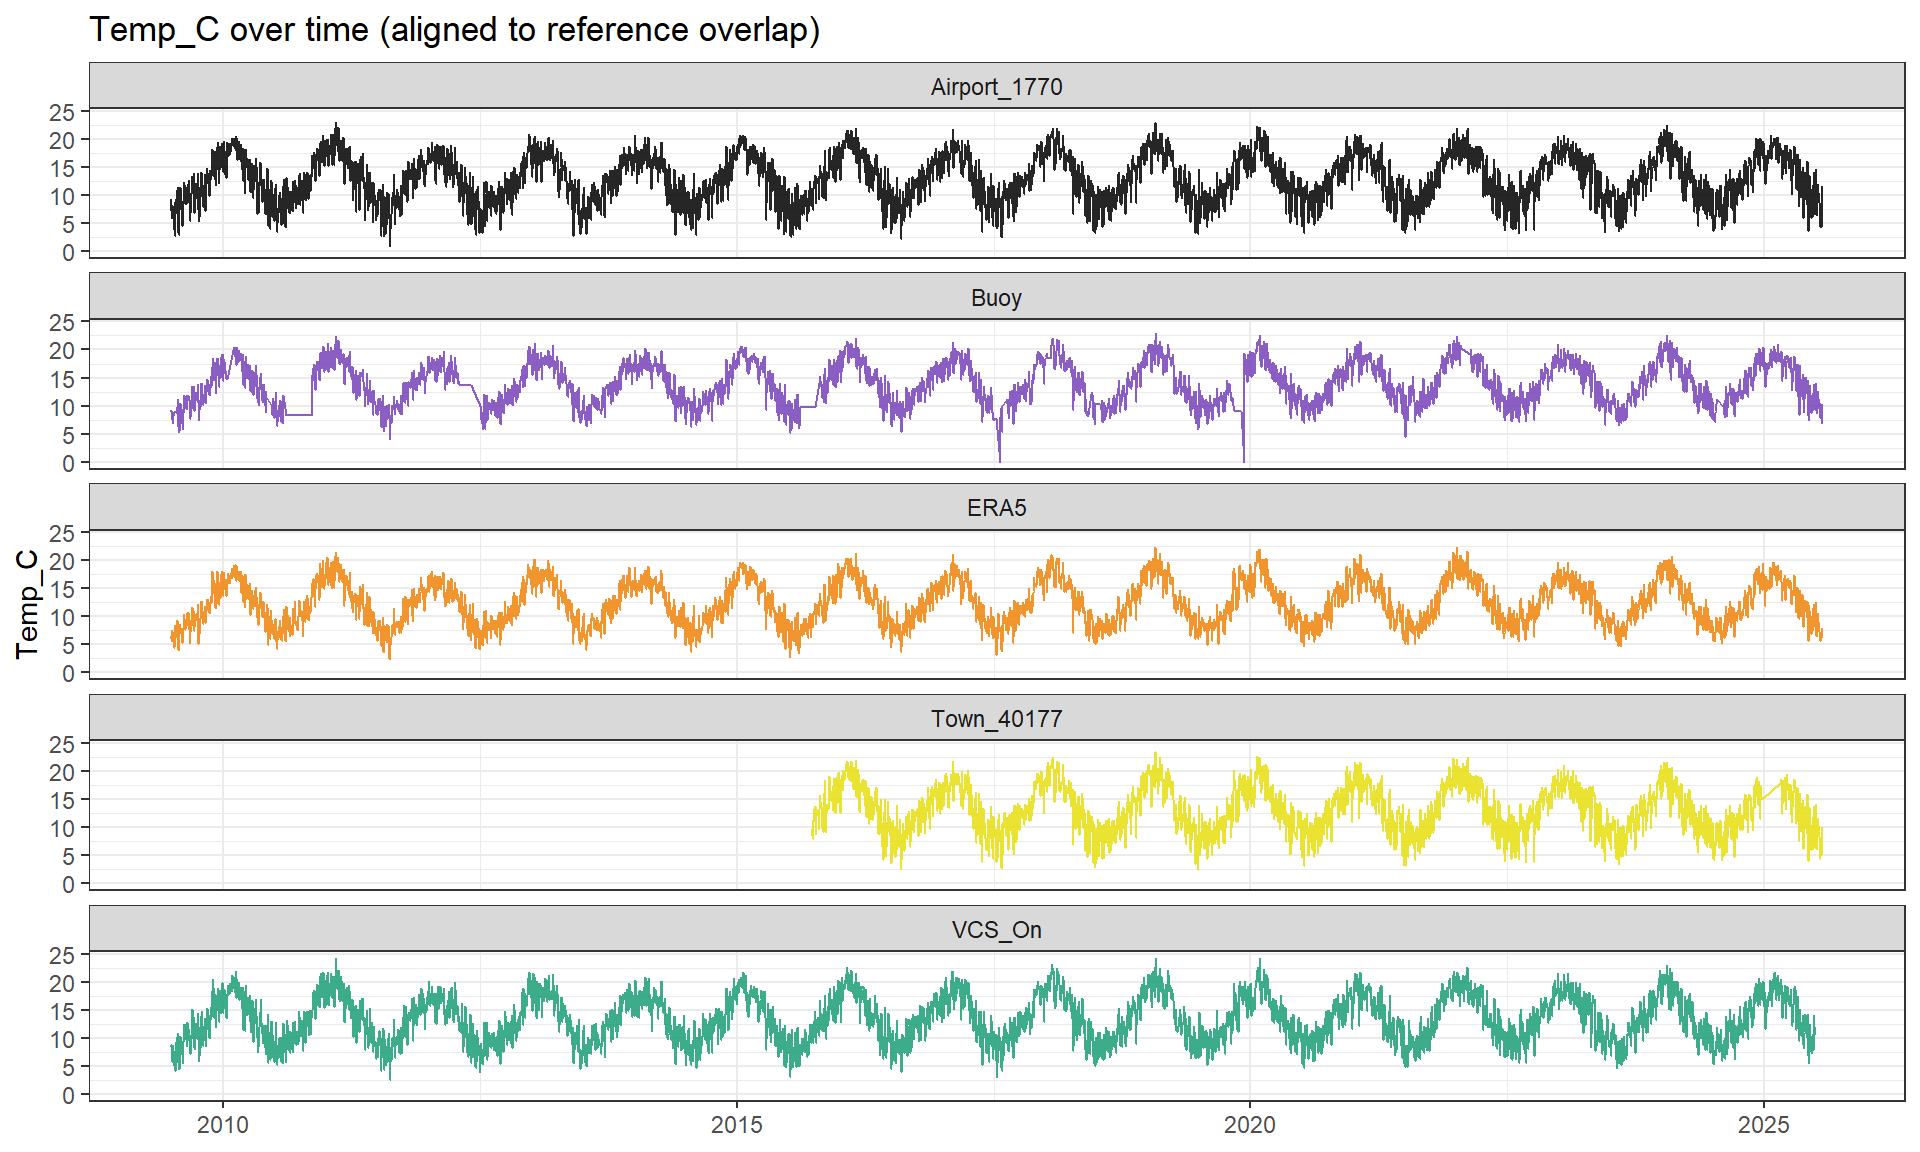
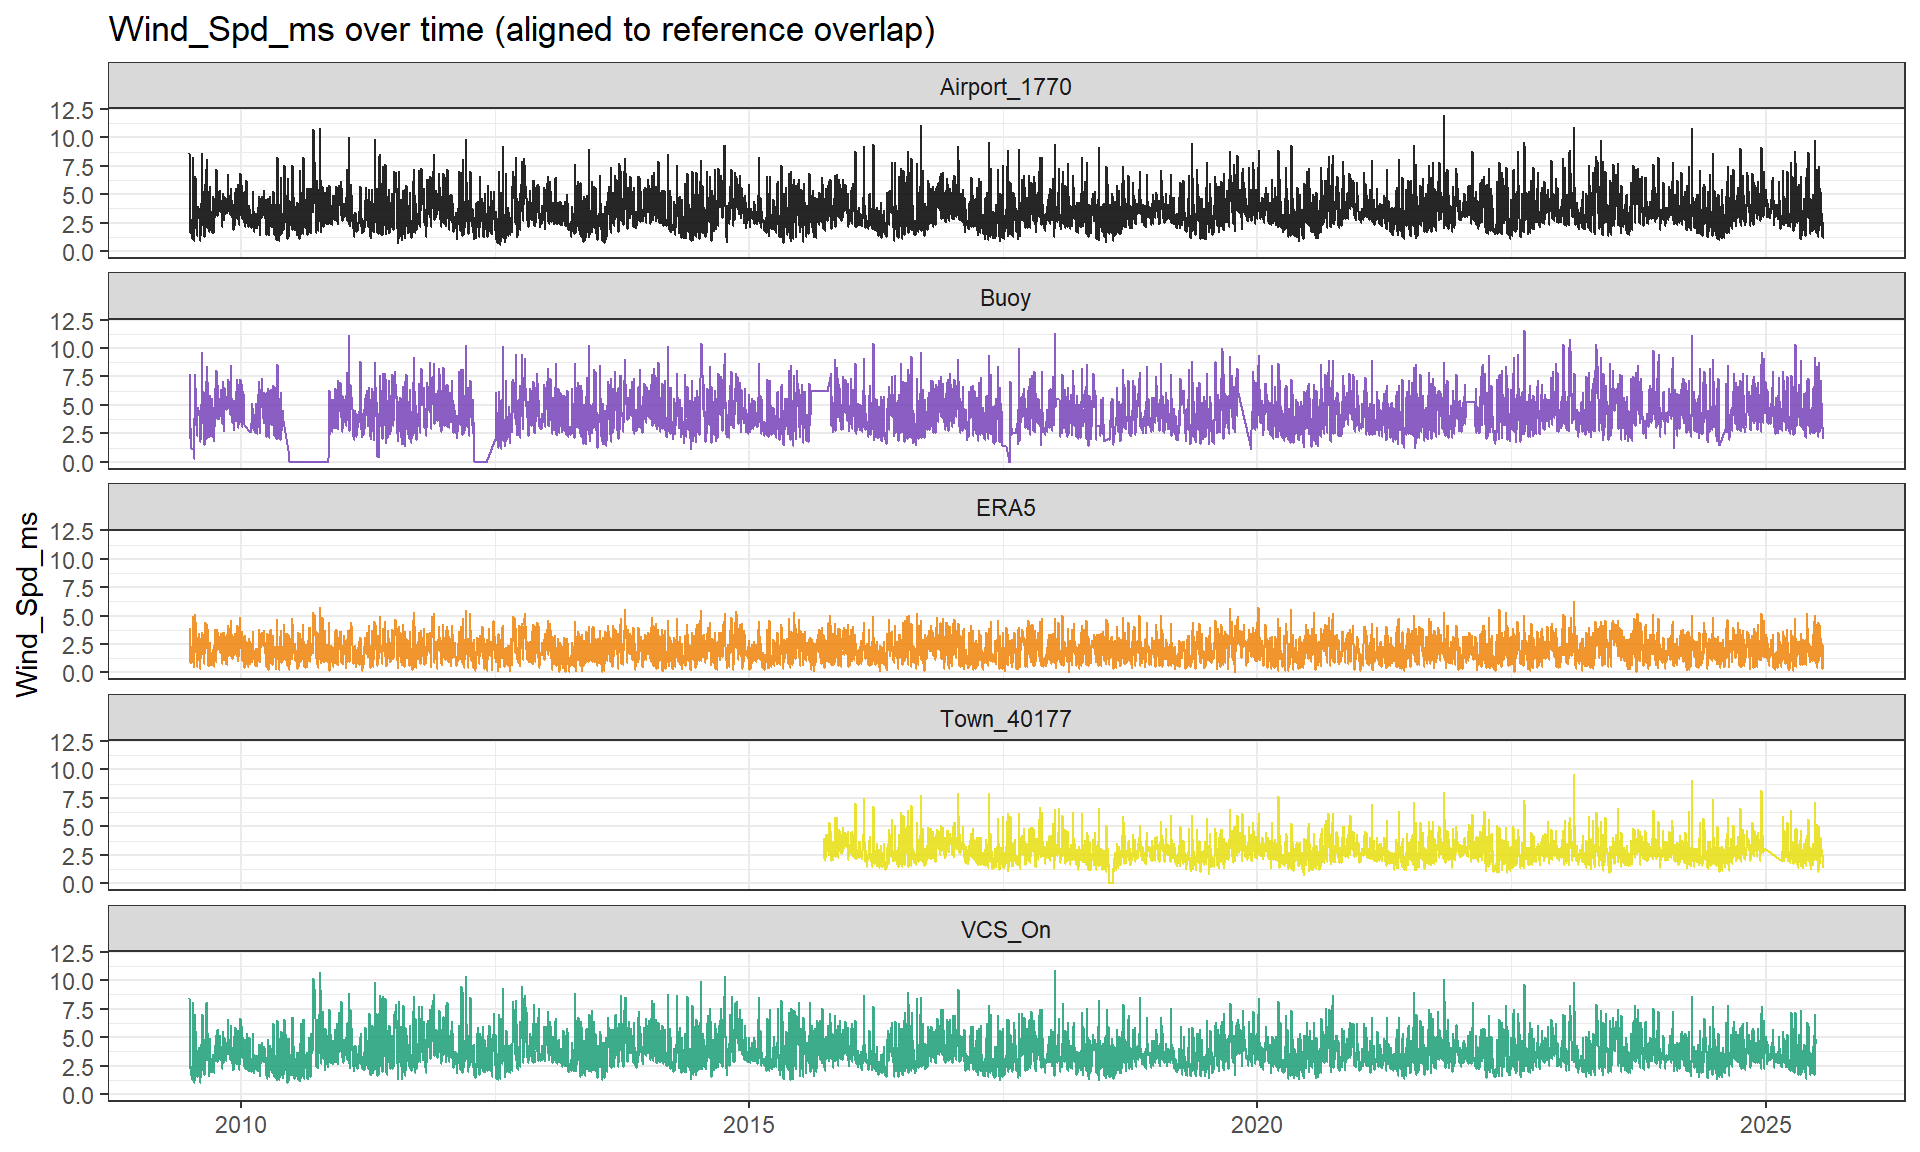
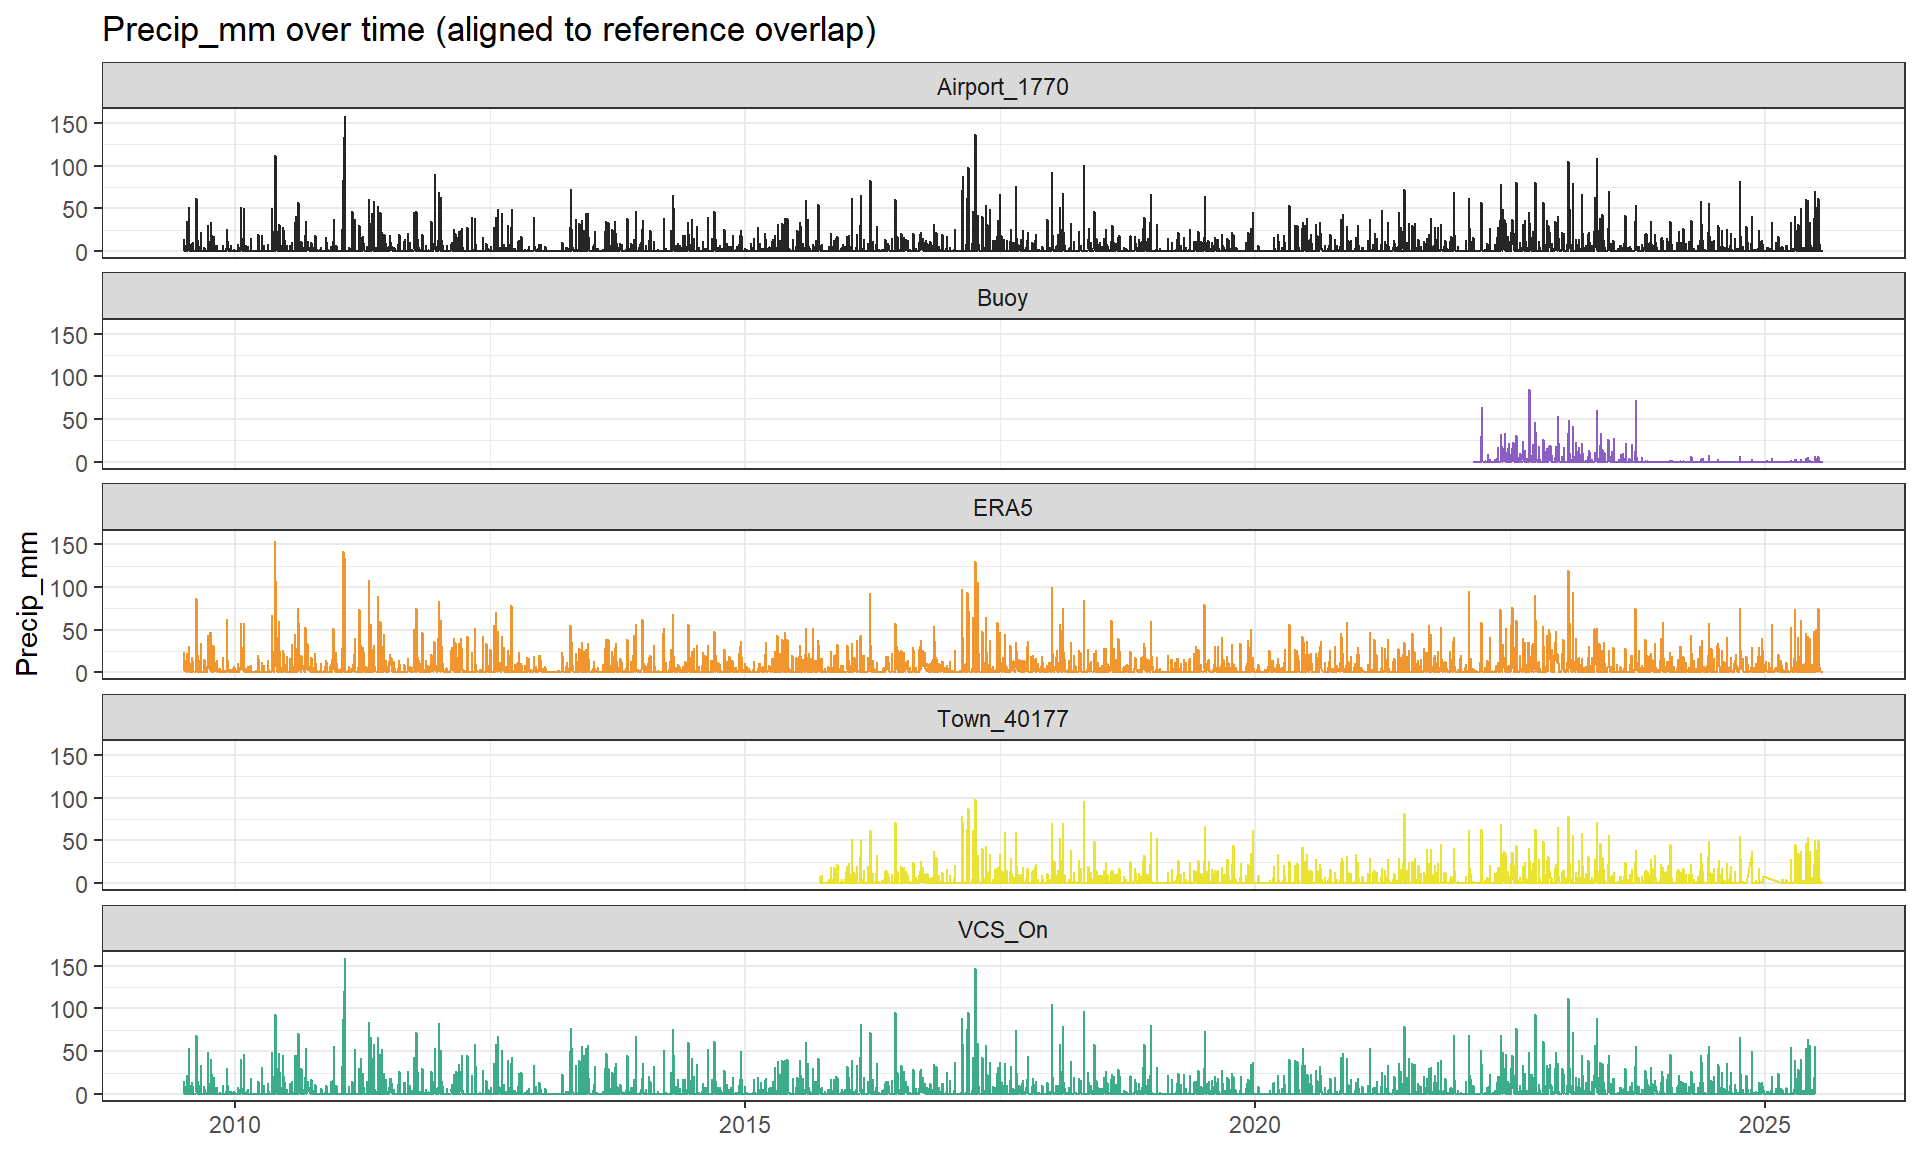
Time-series overlays
Each plot shows the reference (Airport) against targets (Buoy, ERA5, Town, and Virtual Climate Station -VCS) for a single variable.
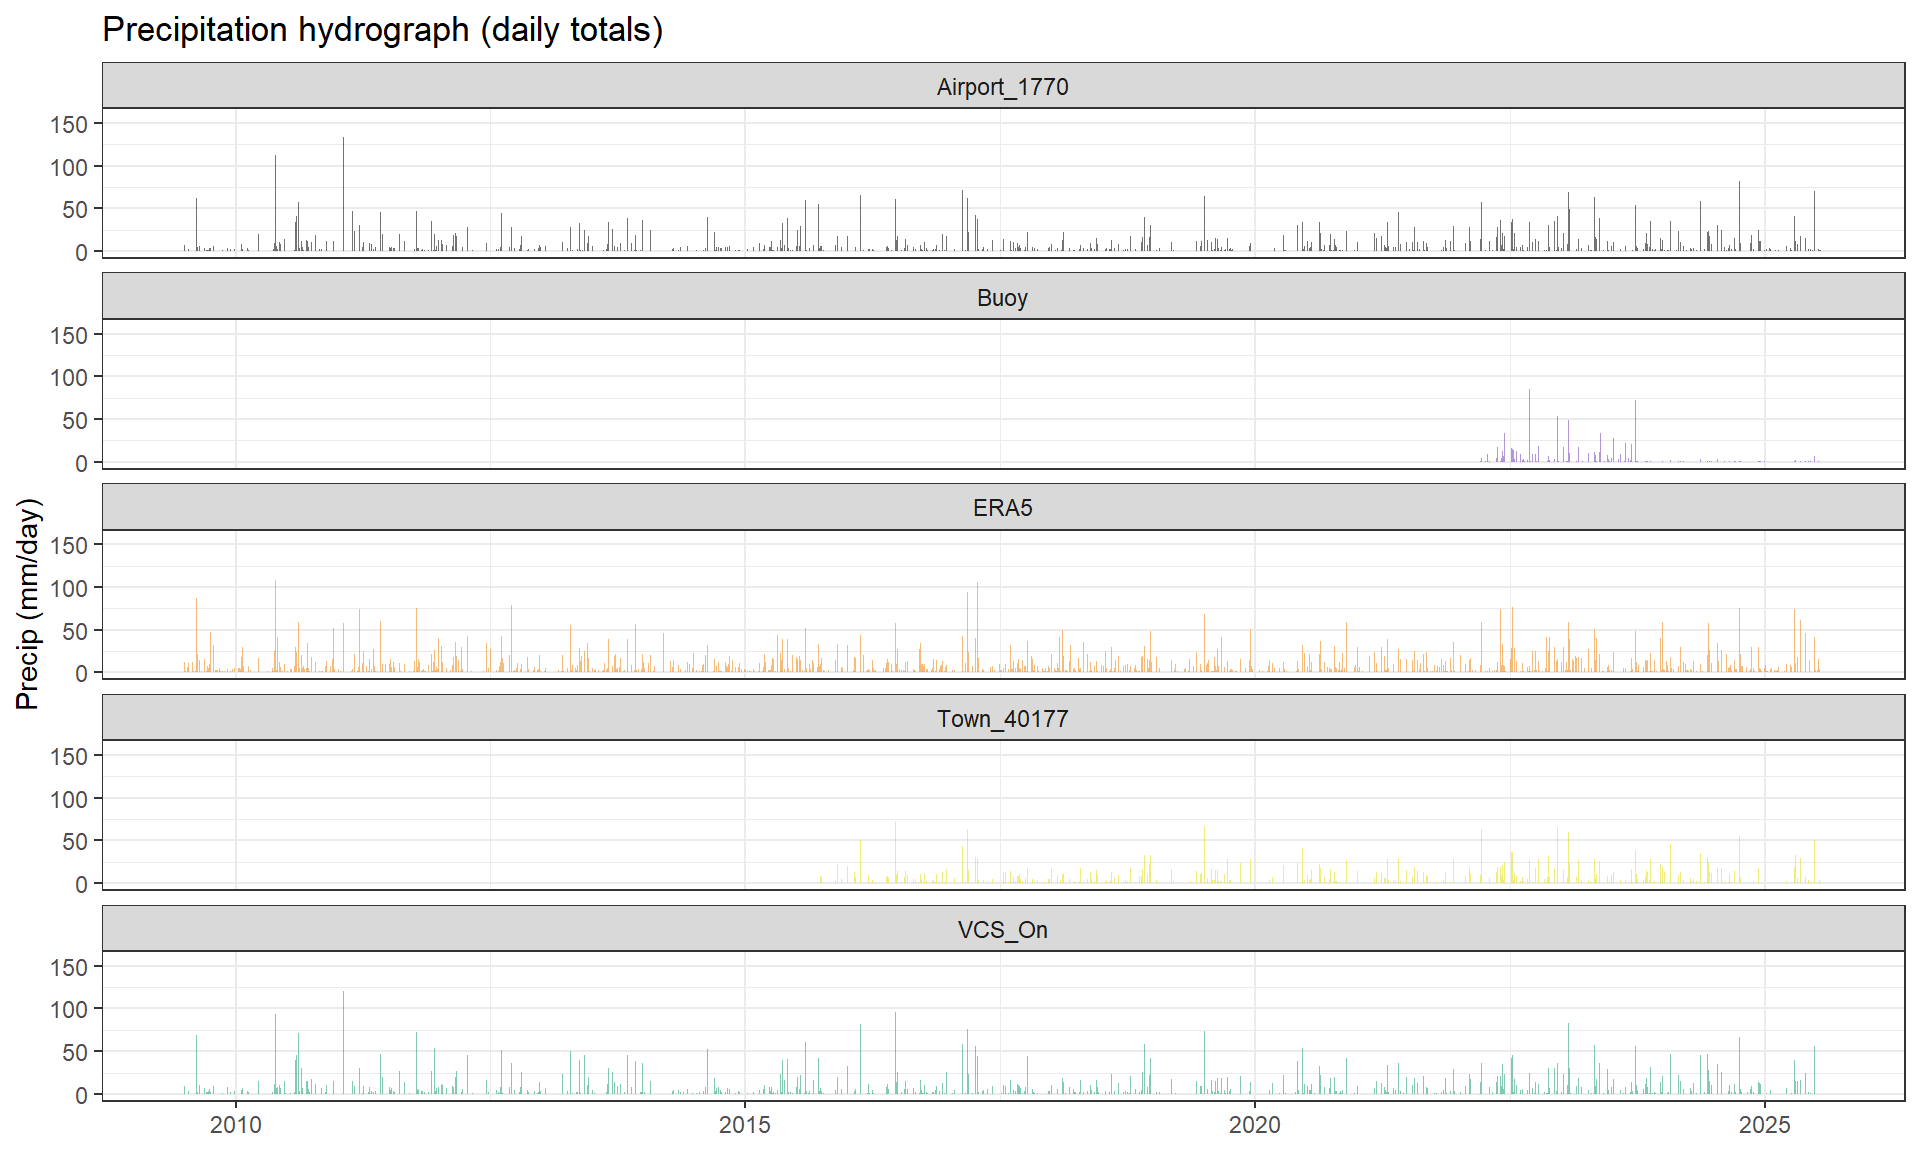
Toggle between timeseries and hydrograph
Latest daily snapshot
Quick look at the most recent reported day from each dataset.